What we are about to witness in the markets will be similar to watching a gigantic controlled demolition. The initial charge that starts the whole sequence of momentous events is the dollar breakdown of recent days. This was triggered by the imposition of destructive trade tariffs by the Trump Administration who then made it plain they were happy to see the dollar drop to make US exports more competitive. Actions have consequences, and a falling dollar will make dollar denominated investments less attractive, like the Treasurys, which the US depends on to funnel the rest of the world’s wealth into its coffers – the deal has always been this: the US prints up unlimited quantities of dollars and Treasurys, created electronically with a few keystrokes, and then exchanges them for goods and services from the rest of the world, with most of the inflationary consequences of this pushed off onto the rest of the world. Other countries around the world have until now gone along with this scam, because if they don’t they get cut off from the SWIFT system, subjected to punitive sanctions or even invaded, or a combination of the three.
So, the sequence of events in this controlled demolition in a nutshell is this – the dollar drops hard, Treasurys, which are already very close to breaking down from their long-term uptrend, tank, and interest rates skyrocket. The stock market, already massively overstretched, implodes. The speculative urban Real Estate market crashes and gold and silver soar as safe havens, amplified by acute shortage of physical, most of which now resides in vaults in China. Gold and silver miners, already streamlined and efficient, stand to make fortunes as gold and silver prices race far above their respective AISC (all in sustaining cost) break-even levels, and gold and silver stocks skyrocket.
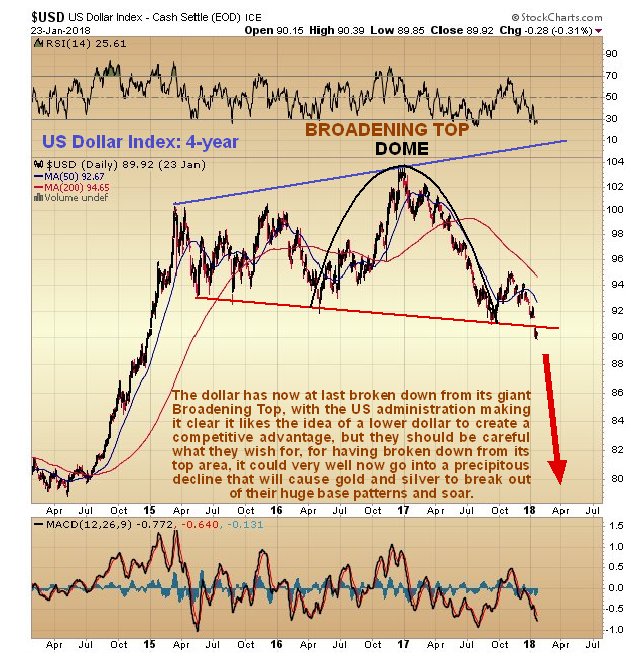
Let’s now look at this sequence of impending market events on the charts. We start with the dollar, which has just broken down from a giant 3-year long Bullhorn Top or Broadening Formation. The dollar’s immediate downside target following this clear breakdown is the 80 area on the index. A drop of this magnitude is huge and will have profound repercussions, not least on the Treasury market, because there will be little motivation to invest in a country whose currency is plunging. This looks set to occur regardless of any bounce to alleviate the short-term oversold condition.
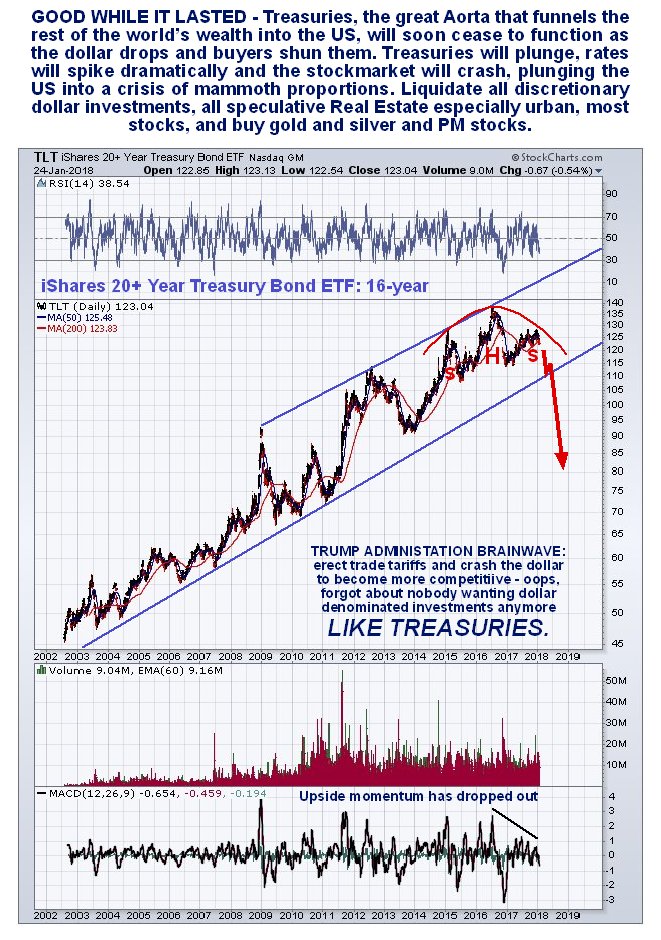
On the long-term 16-year chart for Treasury long bond proxy iShares 20+ Year Treasury Bond (NASDAQ:TLT) we can see that its decades long bull market is showing clear signs of reversing, with upside momentum spluttering and a Head-and-Shoulders top completing. A breakdown from the large uptrend shown will usher in the first serious bear market in Treasurys for years that will send interest rates soaring, which will create an acute financial crisis in the debt-wracked US. With the dollar set to plummet this breakdown could happen soon.
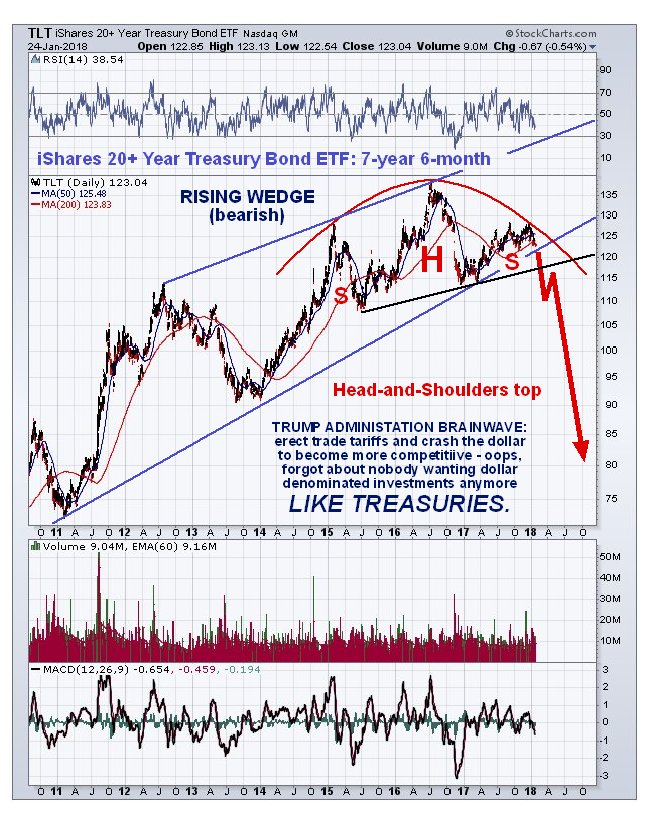
On the 7-year 6-month chart we see that, within the giant uptrend shown on the 16-year chart, a bearish Rising Wedge has formed culminating in a Head-and-Shoulders top, which it is now very close to breaking down from.
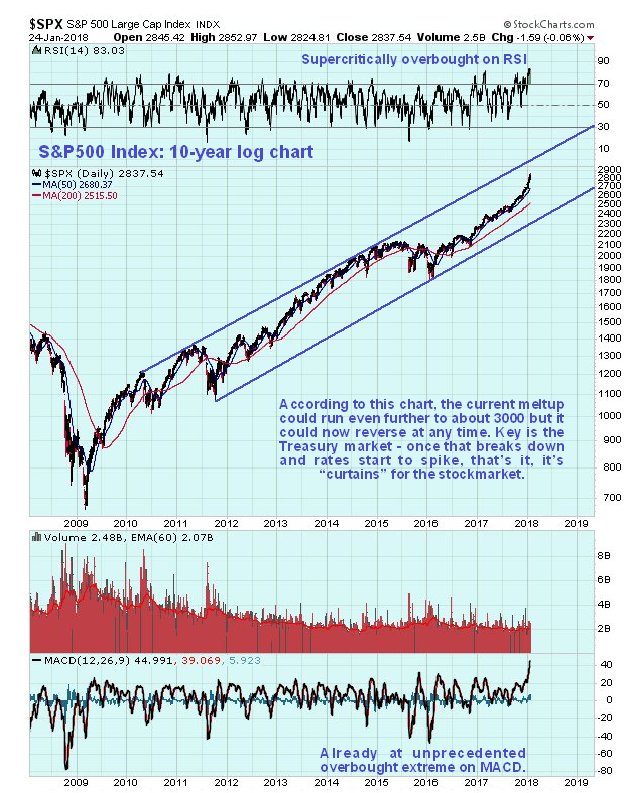
Soaring interest rates will quickly rip the rug out from under the wildly overextended US stock market, which will crater in a manner that will make the ’29 crash look like a walk in the park. On the 10-year chart for the S&P 500 index we can see that the current meltup could run even further to the upper channel boundary of the channel shown on this long chart, before investors have a very nasty reality check, although it could reverse now at any time, especially given the dollar’s slide and the storm clouds gathering over the Treasury market.
With Treasurys out of the question as a bolthole, safe haven money will gush into gold and silver, which will soar since there is already an acute shortage of physical, even before gold and silver have broken out of their large base patterns. This will bring a wry smile to the faces of Chinese bankers who have been squirreling away vast quantities of gold as fast as the stupid West would sell it to them. As for the US trying to tell China what it can or can’t do in the South China Sea, it will be lucky to be able to finance a task force to sail over there, the way things are going, and if it does the Chinese have the military capability to send it to the bottom in less time than it takes to boil an egg, if they so choose.
Turning now to the charts for gold and silver, we see fine large base patterns completing in both. The extensive talk about manipulation suppressing prices of gold and silver is largely “sour grapes” by those who were too slow-witted to “get with the plot” and jump on the bandwagons that were rolling elsewhere, in Biotech, in Bitcoin, in the FANGs, in the broad market itself etc. These other bandwagons are now set to come to a abrupt halt by in some cases slamming into a wall like Bitcoin, as gold and silver take center stage again.
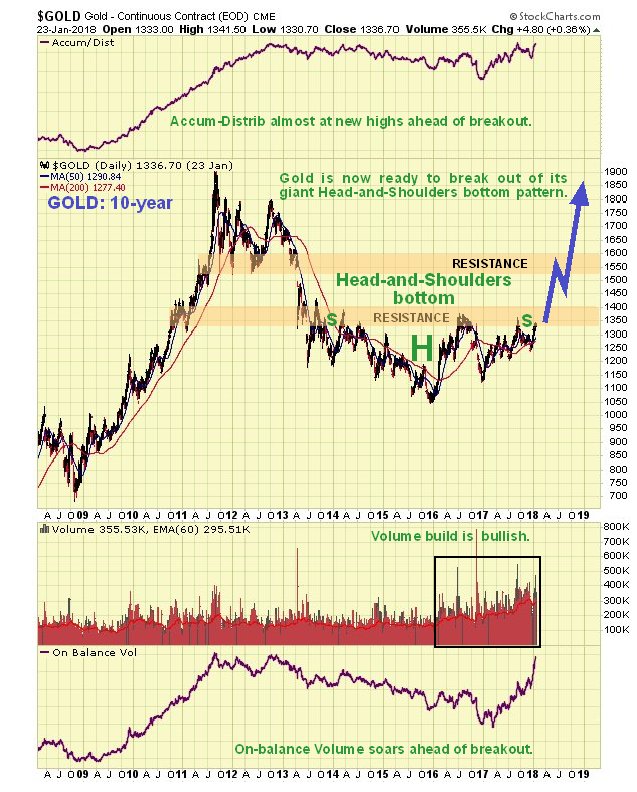
Gold is rapidly approaching completion of a fine large pleasingly symmetrical flat-topped Head-and-Shoulders bottom, with the massive volume buildup as the Right Shoulder of the pattern has formed, that has driven volume indicators strongly higher, giving the game away that it is shaping up for a major bullmarket. Breakout will be signaled by a break above the “neckline” resistance at the upper boundary of the pattern, a break clear above $1400 should do it. While there is another band of strong resistance to contend with in the $1530 - $1600 zone, it shouldn’t have too much trouble breaking through that, given the conditions that we are rapidly heading towards.
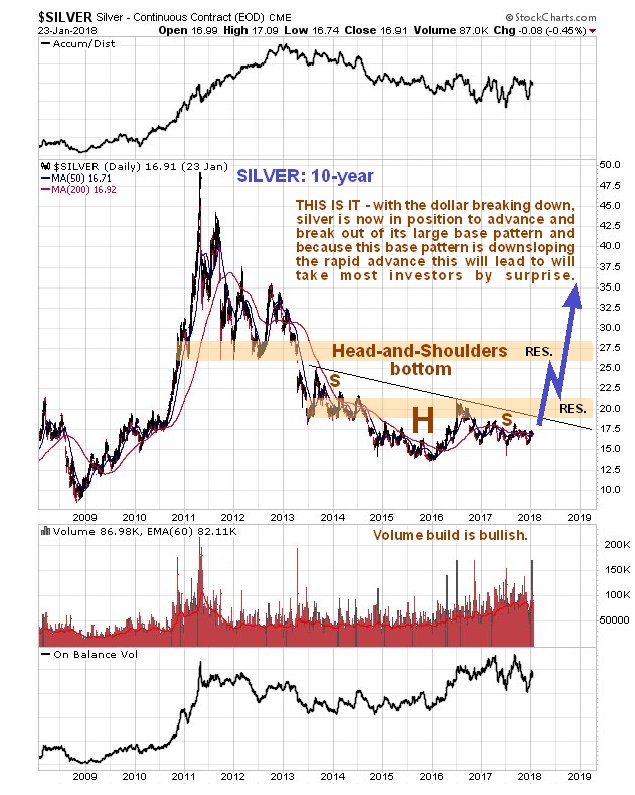
The picture for silver is very similar, except that silver’s Head-and-Shoulders bottom is downsloping, because silver tends to underperform gold at the tail end of bearmarkets. Because this downslope camouflages the incubating bullmarket much more than is the case with gold, it creates the conditions for explosive upside when the bullmarket does get going, especially as silver tends to be leveraged to the price of gold. It is actually hard for many investors to comprehend the upside potential of silver stocks after the long bearmarket.
When these bullmarkets at last get going in gold and silver, the gains in many gold and silver stocks are going to be breathtaking, here’s why. Taking the case of gold producers, their performance is highly geared to the price of gold, because of their hefty and at times extremely burdensome fixed costs. All-in sustaining costs (AISC) are what it takes to keep the lights on and remain (just) economically viable, it’s what it costs to produce an ounce of gold. In the case of many gold producers it is about $1000 - $1200 an ounce. If the price of gold is say $1200, which is a little below the mean cost in recent years, and a gold company’s AISC is $1100, then it makes just $100 profit per ounce of gold.
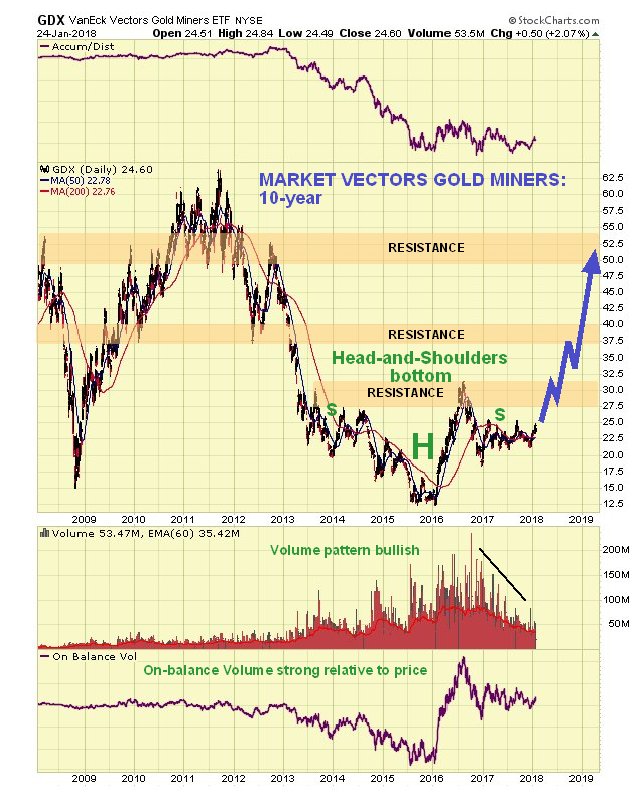
So what happens if the price of gold rises $1000, to $2200, which is a modest level given where we are headed? That’s right – the company’s profits go from $100 an ounce to $1100 an ounce, a MORE THAN 10-FOLD INCREASE IN PROFITS! – you don’t have to be a genius to figure out what effect this is likely to have on the stock price. We already saw an example of this leverage during the 1st half of 2016. Towards the end of 2015 gold and silver mining companies were being squeezed until the pips squeeked by extremely low metals prices, with gold dropping as low at $1050 – many were bleeding red ink and on the verge of shutting up shop, but look what happened when gold and silver prices rose sharply early in 2016 and the pressure came off – gold stock indices soared, as you can see on the 10-year chart for the GDX (NYSE:GDX) below, which more than doubled in the space of a few months, and you can also see that like gold and silver themselves, GDX (and other gold stock indices) is marking out a large Head-and-Shoulders bottom, and is still some way from breaking out of it so stock prices are good.
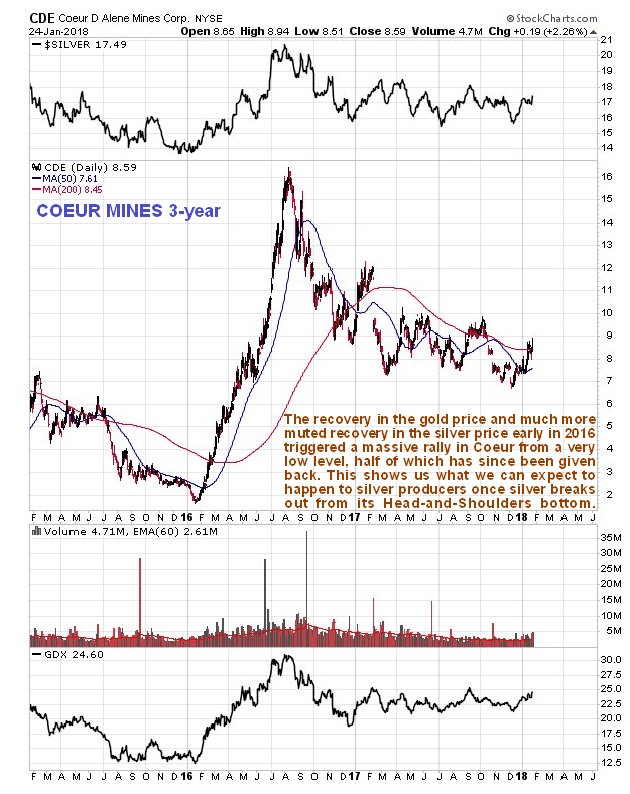
If you want to see an example of the sort of rises we can look forward to when gold and silver break out of their base patterns, we need look no further than Coeur Mining Inc (NYSE:CDE), which rose from under $2 to over $16 in the space of a about 7 months, which is a more than 8-fold increase!! Coeur has since given half of this back, but looks poised to make a similar move when silver breaks out, although in percentage terms it probably won’t be so big because it will be rising from a higher level.
For those of us who really understand what’s going on it’s a tragi-comic sight to see millions of Americans shuffling like sheep into polling stations to vote on the one day every 4 years when the country is purportedly a democracy, thinking that their puny vote might make a difference, which it certainly won’t, given that they are presented with the grand total of just 2 parties to choose from (apart from a token eccentric or two who garner perhaps 150 votes and are tolerated to give a veneer of democracy), with the politicians representing these 2 parties owned and vetted by all the interest groups listed above. It’s going to be a sad day for those who have hijacked the United States when the dollar and Treasury market collapse and the source of their power dries up, which could happen a lot faster than many think possible.
