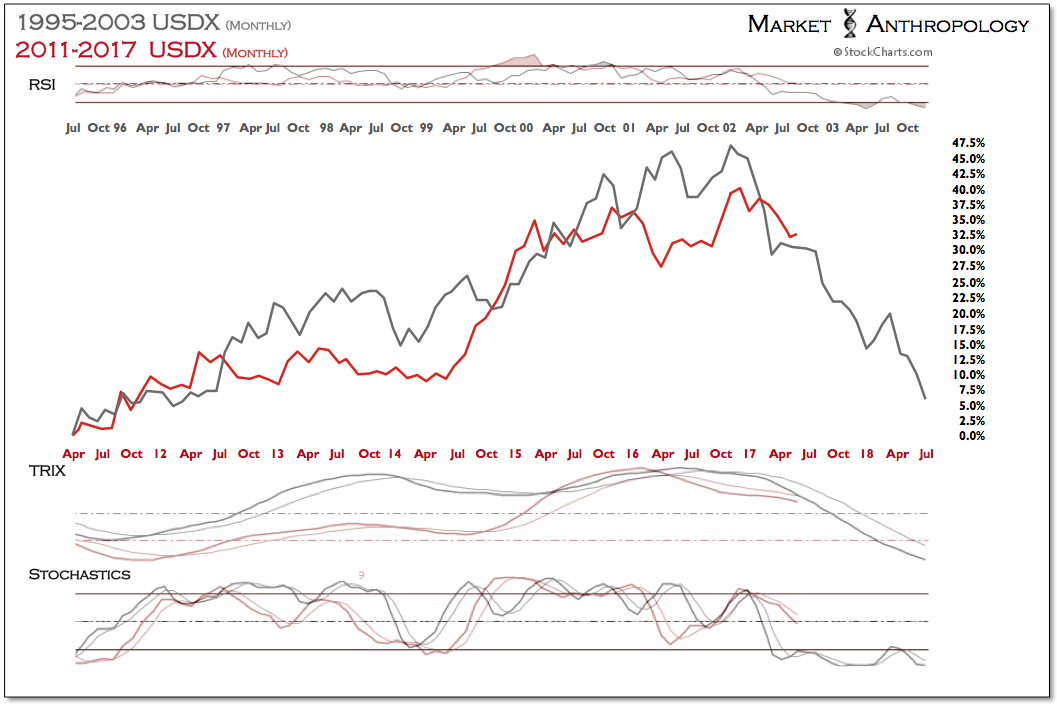
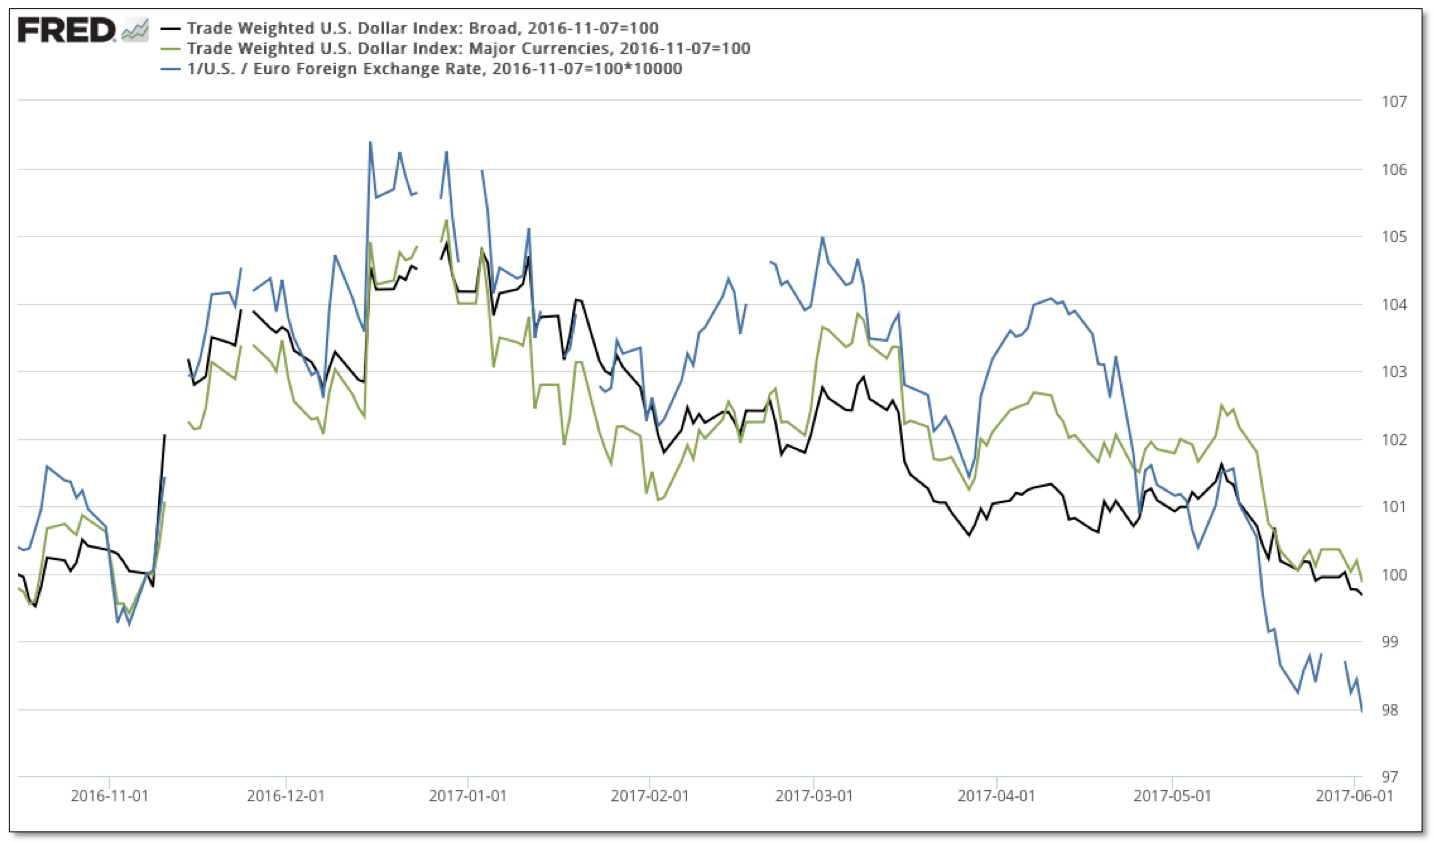
Finding support around last November’s lows, weakness in the US dollar paused last week with various dollar benchmarks now displaying full retracements of the post-US election rally.
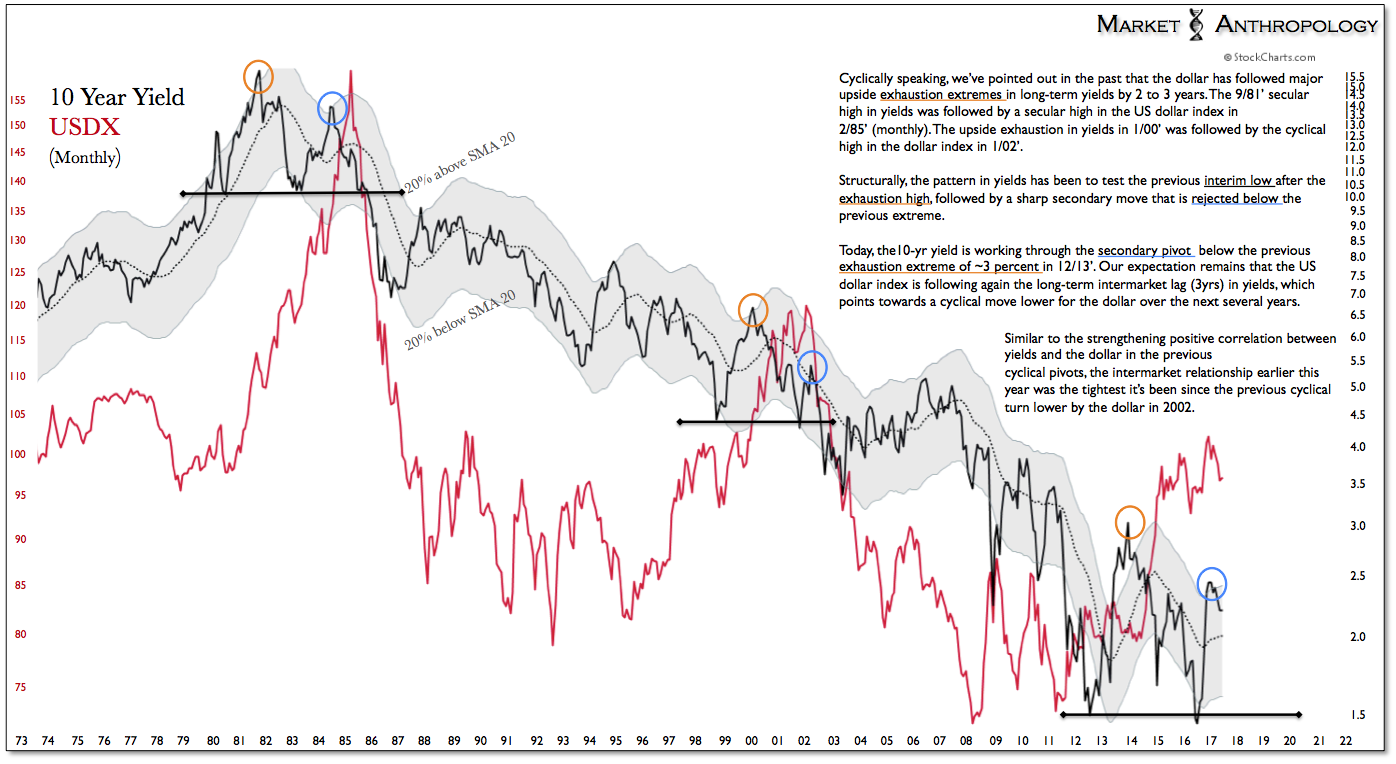
While it wouldn’t surprise us to see recent support extended before the Fed decision Wednesday as the dollar’s oversold condition eases, we foresee two additional moves lower unfolding this year—the first over the near-term as the Dollar Index slips back against the lows from last year—and a larger second break as support from the broad top extended over the past two years is finally broken.
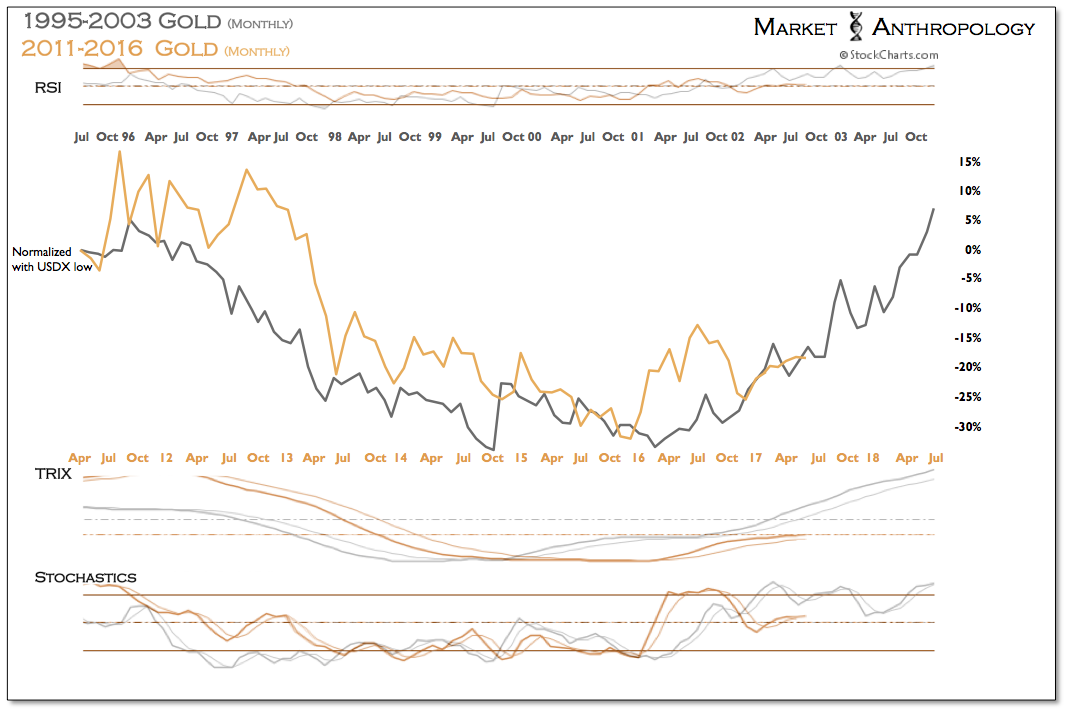
Coming into last fall we had noted that the US Dollar Index was mimicking the broad top carved by gold back in 2011 through 2013, where it traded on the flip side of the cycle as inflation crested in 2011 and the US dollar and real yields began to materially rise out of their cycle lows.
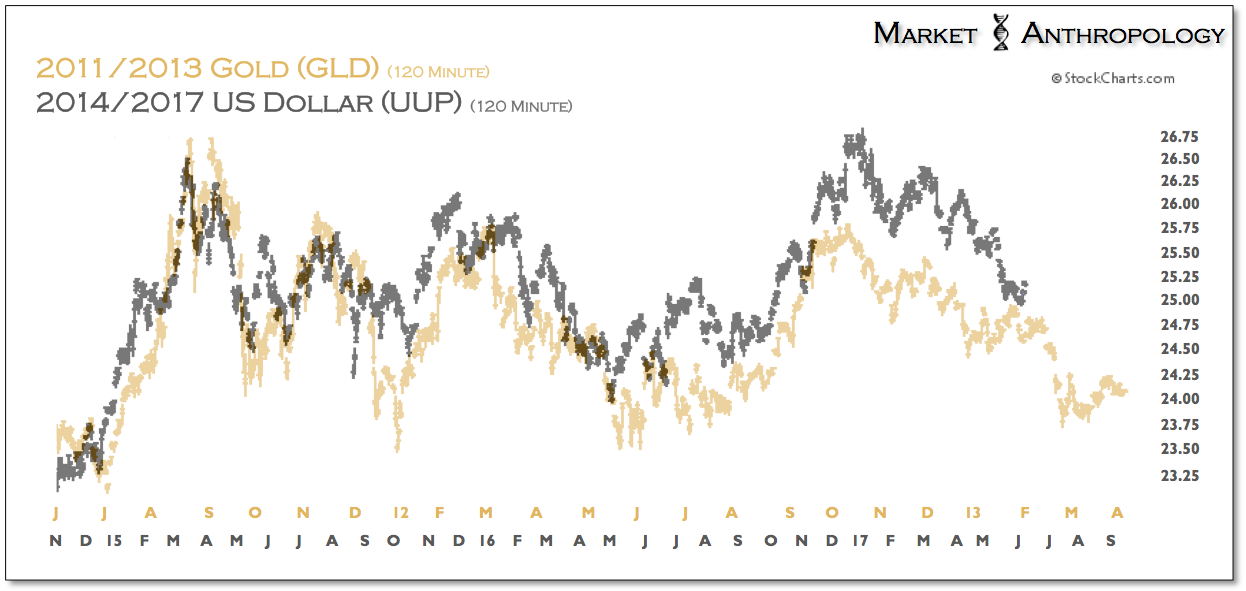
Despite the post election rally to new highs in the US Dollar Index last December, the complex and broad pattern displayed in both tops has been quite similar.
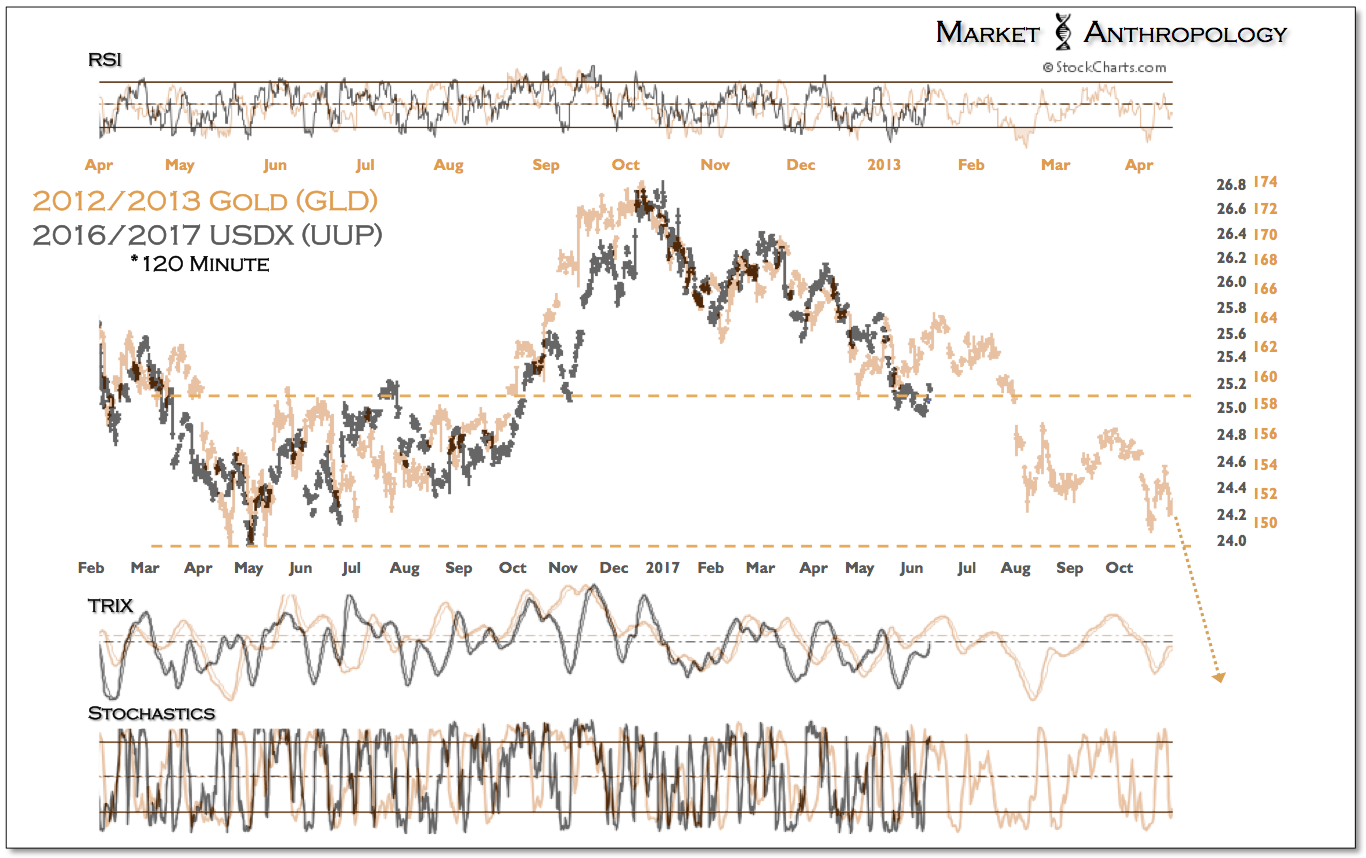
Just as the suggestion and enactment of QE3 in September 2012 encouraged a bull trap in the precious metal sector on misplaced beliefs of renewed inflationary pressures, the broad based reflationary rally that began last year and was further fortified after the election on renewed expectations of stronger growth and higher nominal and real yields, triggered a short-lived breakout in the US dollar.
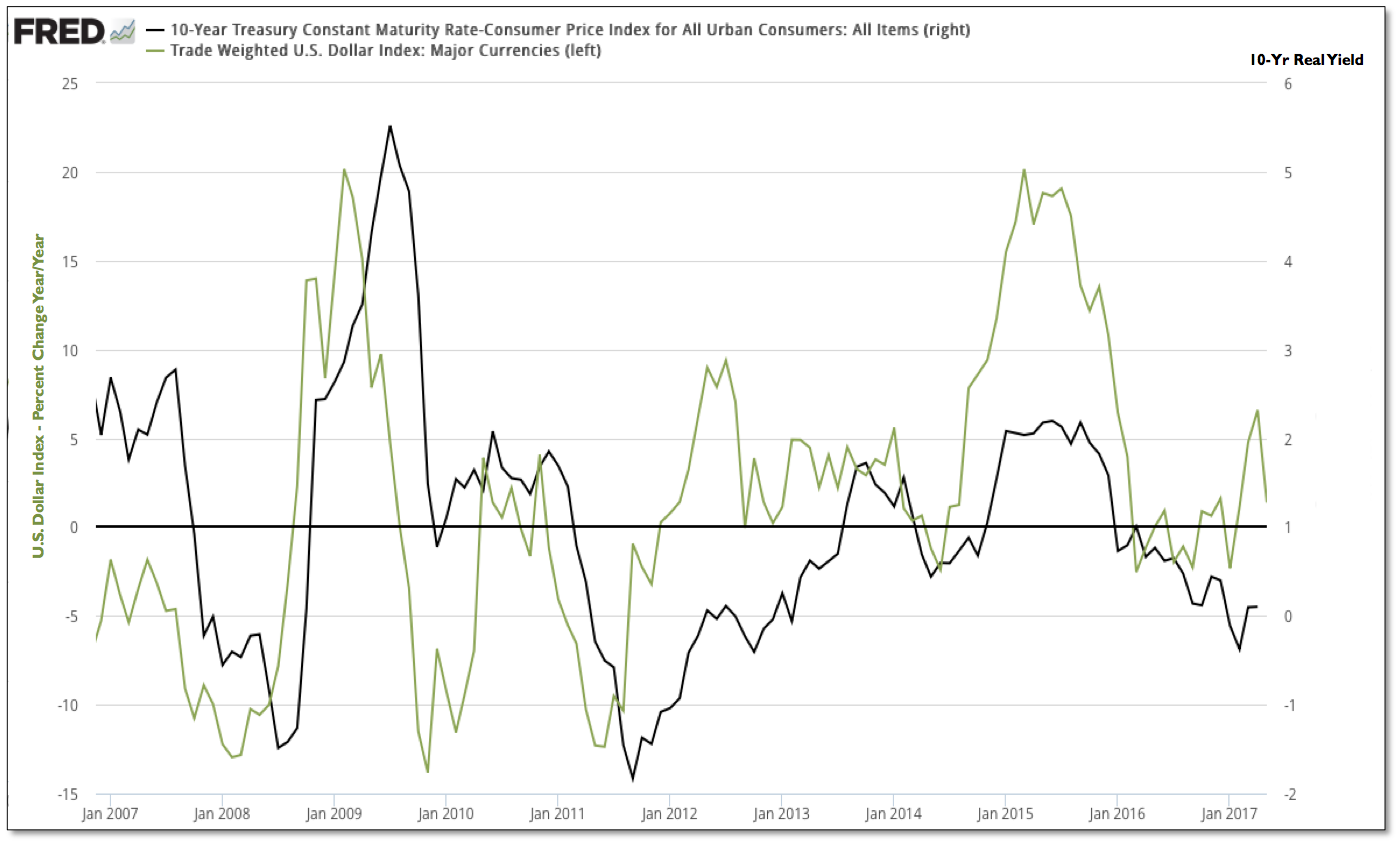
As we have shown over the years, the dollar's performance has been one of the primary driving forces behind the direction of real yields, with gold naturally closely tracking the inverse performance of both.
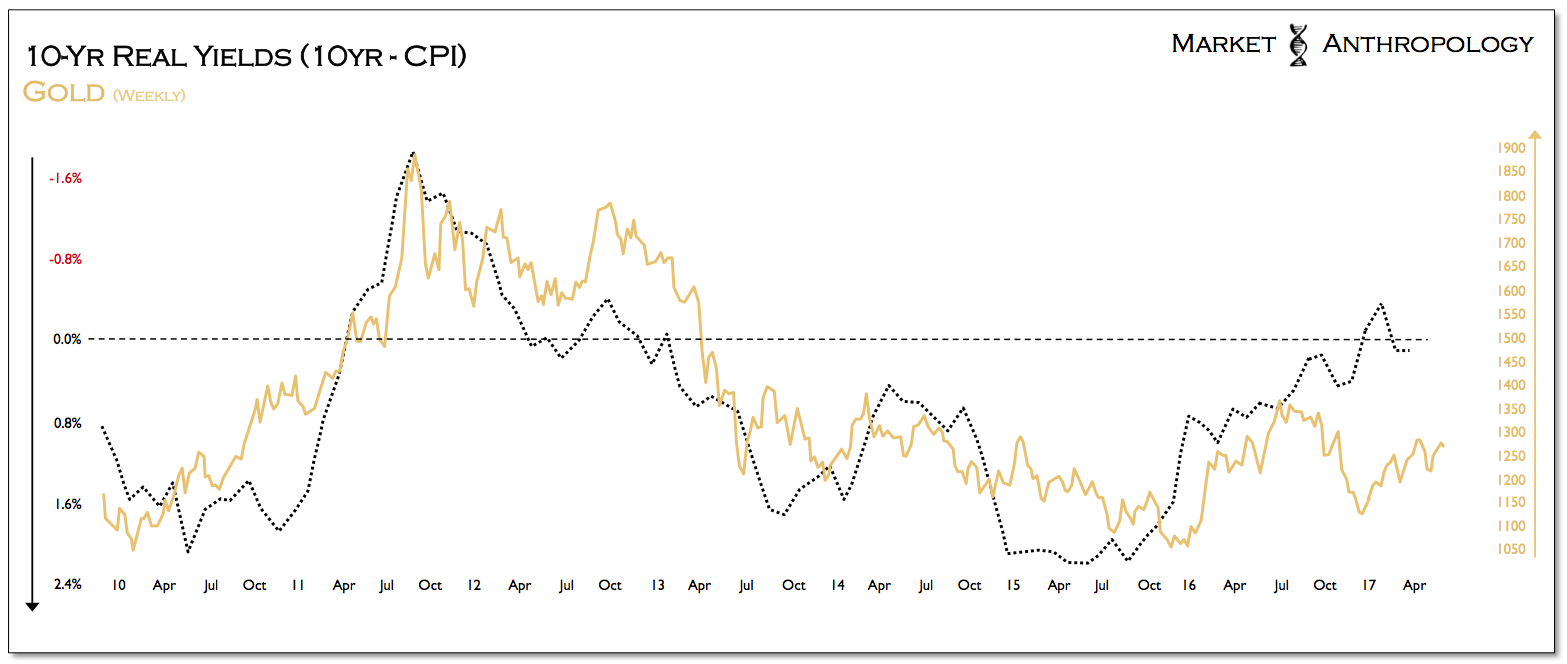
When real yields began to move out of the cycle lows in 2011, a bear market in precious metals and commodities began to take hold, as the opportunity costs for holding non-interest bearing hard assets became less attractive while disinflationary pressures began to strengthen.
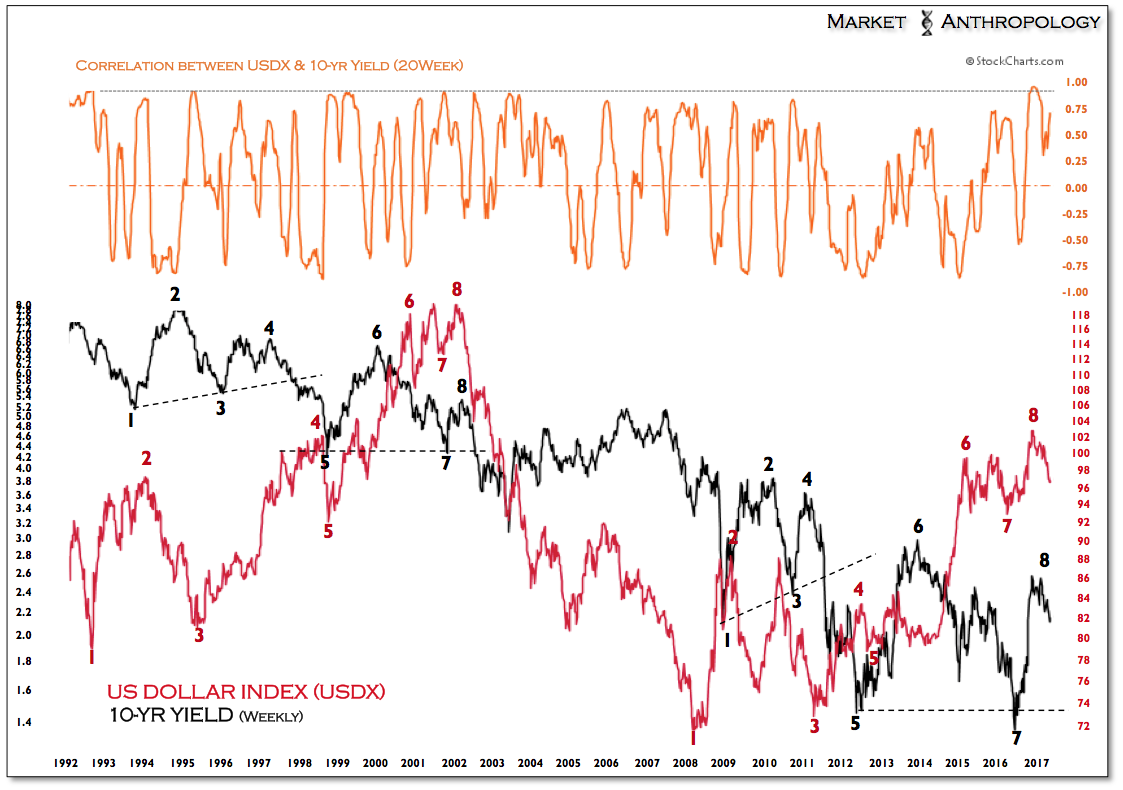
From a big picture outlook of the markets' current disposition within the trough of the yield and growth supercycle (i.e. 1940’s trough to today), we would argue the inflation vane these days is less influenced by growth than the direction of the US dollar, which significantly strengthened as the US led the world out of the financial crisis in 2009 and has largely remained range-bound for the past two years as the expansion matured and the ECB and other major central banks followed the Fed's lead. Until the growth cues of stabilizing and rising yields materialize for a considerable period, the notion of a more secular continuation of a stronger US dollar and higher real yields is as misplaced as expectations for sustained GDP growth above 3 percent per year.
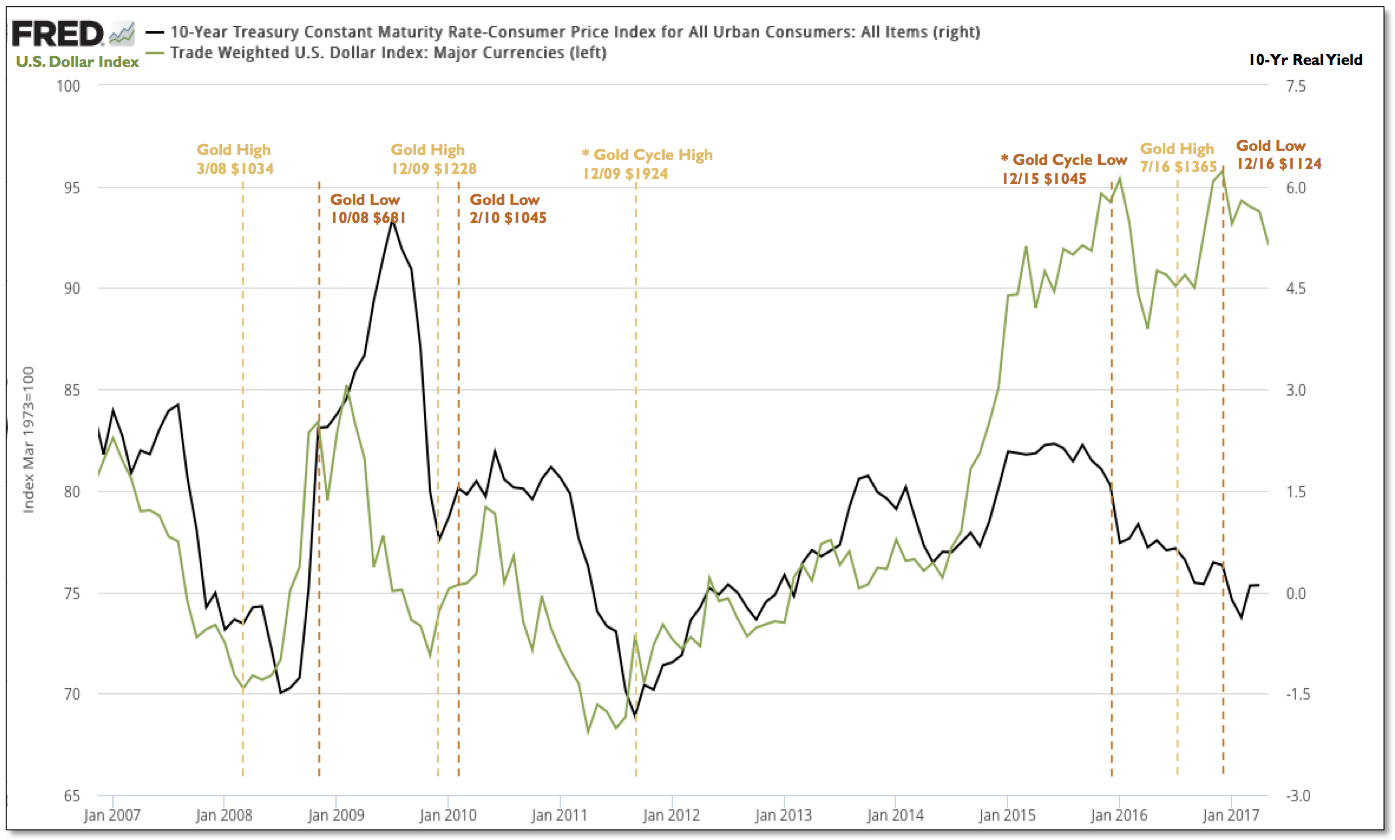
This dynamic was evident as real rates made a lower cycle high in 2015 and began rolling over, despite a surging US dollar that was primarily driven by global monetary policy differentials with the Fed. What was basically missing from the higher real yield equation at that point in the cycle was rising nominal yields tied to stronger US growth, conditions largely improbable in a mature economic expansion already under the influence of extraordinary policy accommodations for more than 7 years.
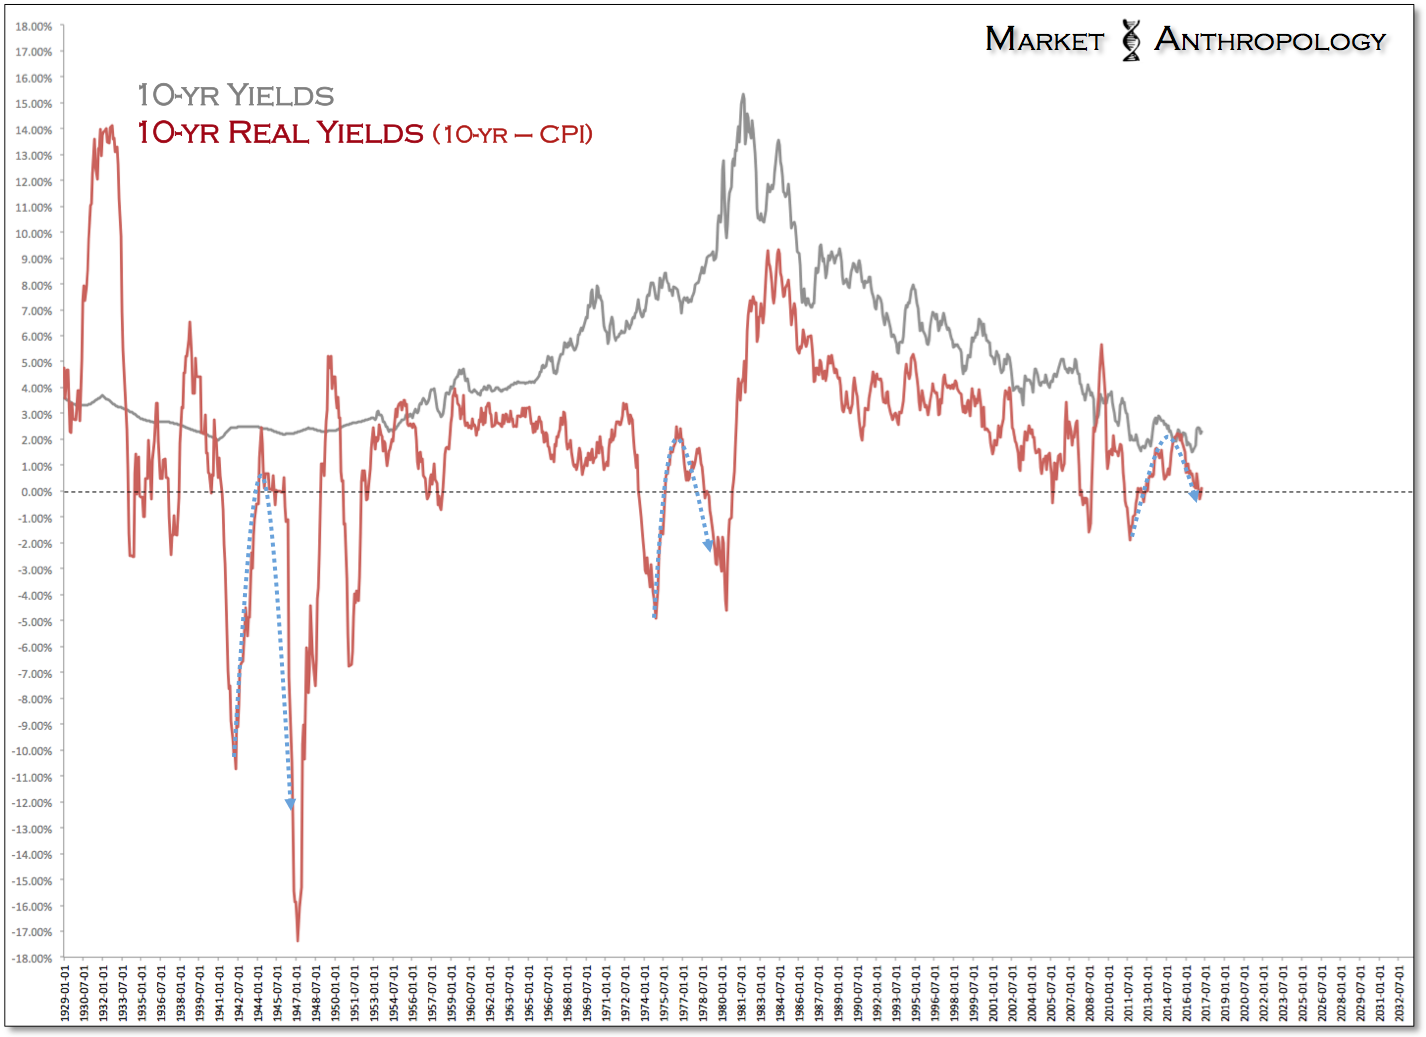
Consequently, the most likely outcome from our perspective is that real yields – at the very least – test their cycle lows from 2011, akin to the sharply negative real yield market environments of the 1940's and 1970's.
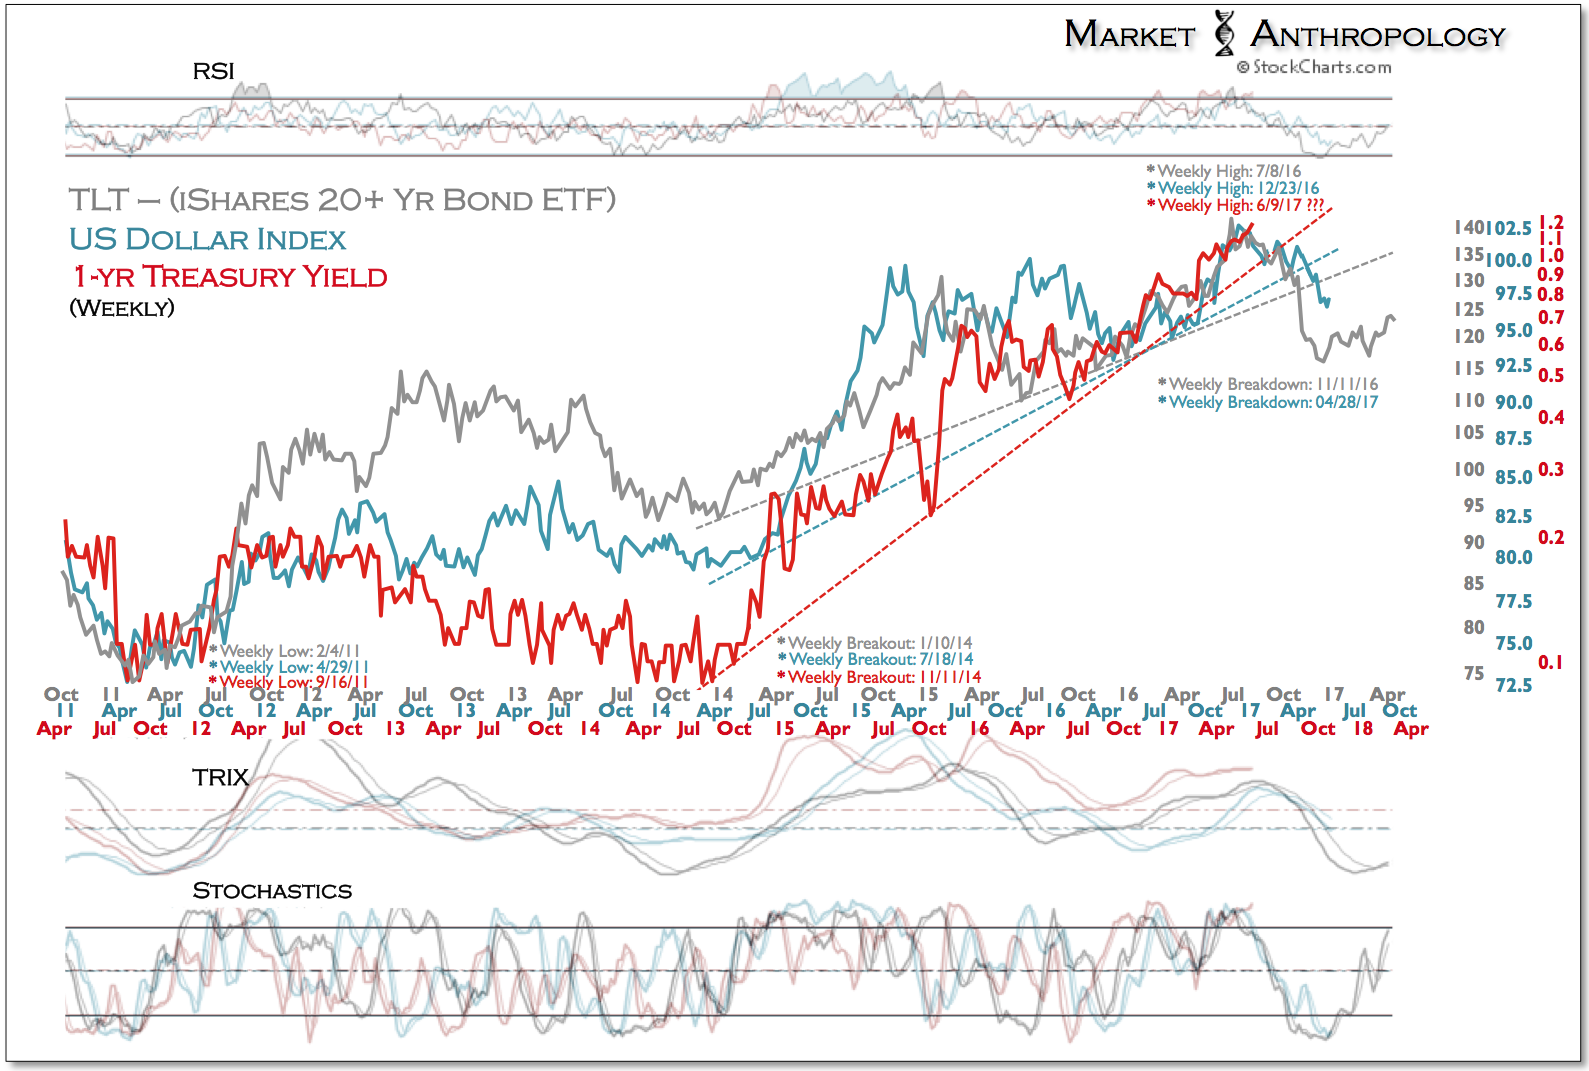
Although the Fed will likely move to raise the Fed funds rate a quarter point higher this week, waning growth and an economy likely at or beyond full employment puts the Fed in a difficult situation going forward, one that realistically doesn’t favor a more hawkish and sustained tightening cycle. As the currency and credit markets often lead policy shifts by the Fed by several months, yields – and more recently the dollar, have weakened ahead of the end of the current tightening cycle.
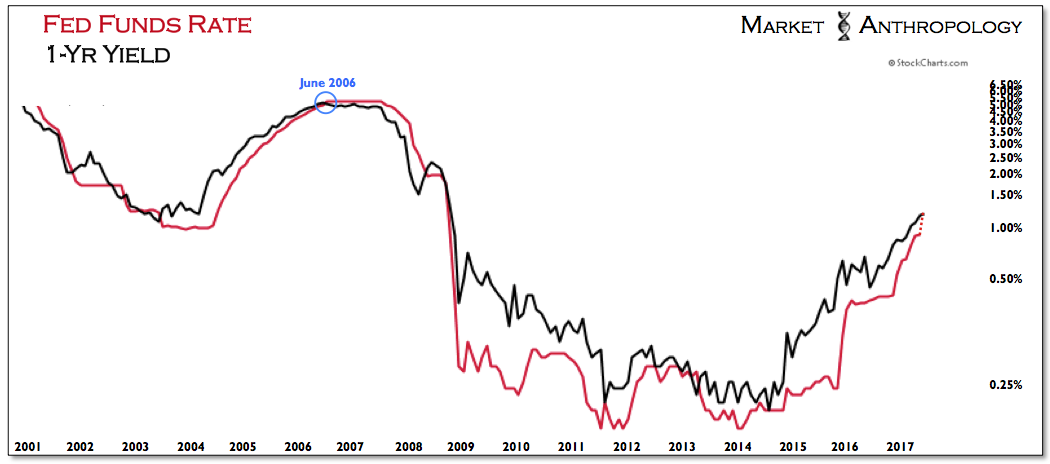
Moreover – and picking up on some thoughts in our last note (see here) in May, should the Fed raise rates again this week, the Fed funds rate will be very close or actually invert with U.S. 1-year Treasury yields, a condition realized at the very end of the last tightening cycle in June 2006.
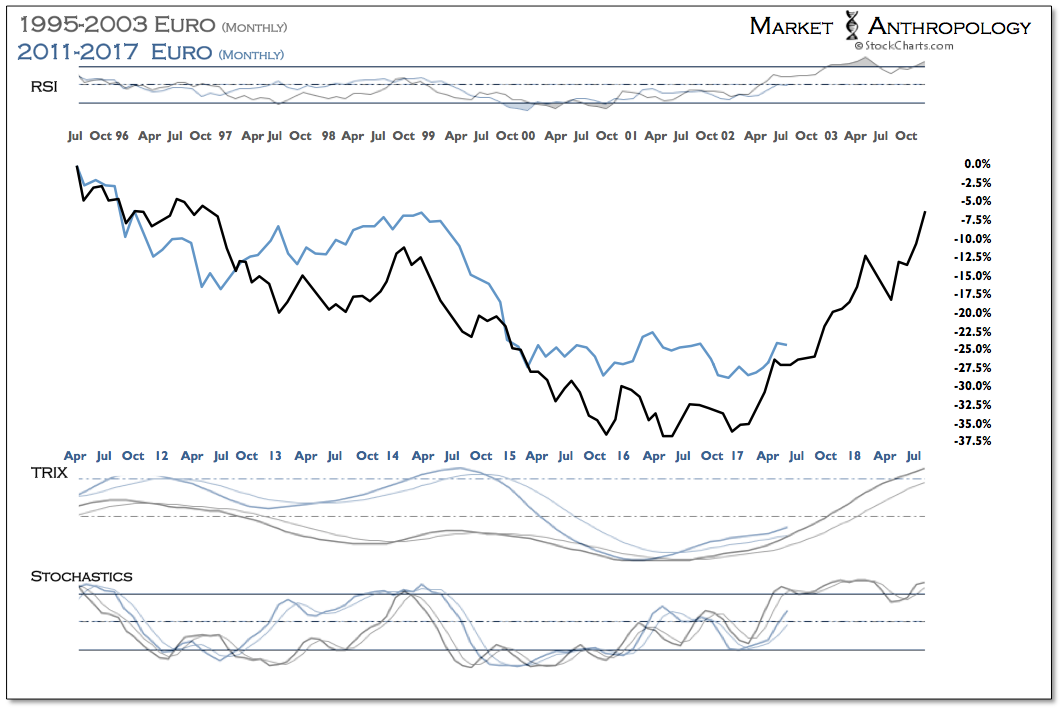
All things considered, we remain bullish on gold, which should continue to find considerable upside motivation as rate hikes by the Fed come to an end and the dollar breaks down further from its cyclical high. Similar to the move in long-term Treasury yields last year, we expect the dollar index to eventually weaken to the trough of its long-term downtrend, which should provide ample motivation for gold and real yields to test their respective cycle highs and lows.
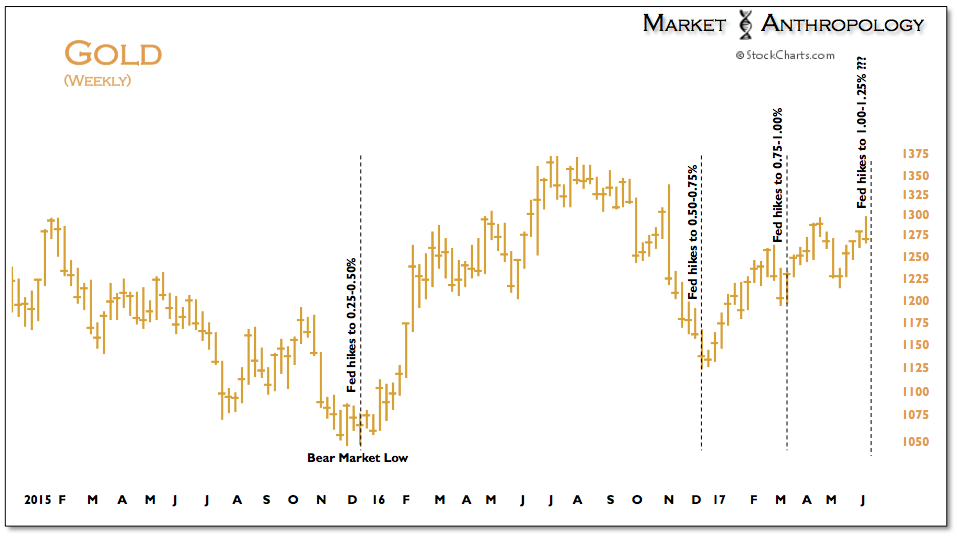
From a near-term perspective, the three previous rate hikes have closely marked retracement lows in gold, with the initial rate hike in December 2015 setting the bear market cycle low (daily close) the next session.
