Get 40% Off
🚨 Volatile Markets? Find Hidden Gems for Serious Outperformance
Find Stocks Now

Commodity Price Forecasts: May 2016

Published 05/05/2016, 08:22 PM
Updated 07/09/2023, 06:32 AM

The article aims to provide forecasts for commodity prices (World Bank’s Pink Sheets) for May 2016. The Pink Sheet is a monthly statistical report on prices of major agricultural commodities, metals and minerals, energy and fertilizers (1960-2016). Monthly prices for the series are published at the beginning of each month. The prices are positively correlated with the futures prices (Column 2 of the Table).

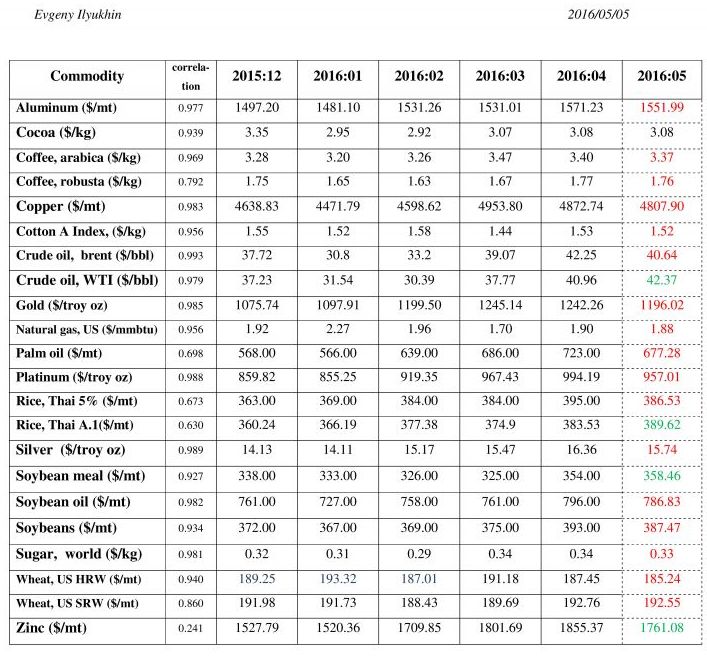
The previous forecasts performed rather well: the Mean of Absolute Errors expressed in percentages was 3.64 while the number of correct trends lowered. Because of both high positive correlation and accuracy of forecasted values it could be recommended to check the values provided in this article. They can be used for identifying price trends for commodity futures. The monthly commodity prices in nominal US dollars over the period from December 2015 to April 2016 (World Bank’s Pink Sheets) and forecasted period (Author’s Calculations) for May 2016 are presented in tables below (futures related commodities are presented only).

The Pink Sheets for May 2016 will be released on June 3, 2016. Forecasts are projected with an Autoregressive Integrated Moving Average (ARIMA) model based on monthly historical data that is relevant for calculations. Commodities are placed in alphabetical order. Forecasted values: increase in green; decrease in red. It is advised to use forecasted values for identifying the short-term price trends over the period firstly. Because of lowered accuracy in forecasting price trends, some ARIMA models have been corrected.

In addition, the forecasted values have been adjusted to the recent price movements. The significant positive changes are expected for Crude Oil WTI (3.44%), Rice (1.58%), Soybean Meal (1.26%). Palm Oil (-6.32%), Zinc (-5.08%), Crude Oil Brent (-3.81%) will likely drop by the end of the month. Despite of high positive correlation between Crude Oil WTI and Brent (0.987) and Thai Rice 5% and A.1 (0.859), the different price trends have been identified while Wheat SRW and HRW (0.973) trends are the same. Notice that correlation ratio between Pink Sheets' commodity prices and futures prices is low (0.241).
3rd party Ad. Not an offer or recommendation by Investing.com. See disclosure here or remove ads .

Commodities Chart

Latest comments

Risk Disclosure: Trading in financial instruments and/or cryptocurrencies involves high risks including the risk of losing some, or all, of your investment amount, and may not be suitable for all investors. Prices of cryptocurrencies are extremely volatile and may be affected by external factors such as financial, regulatory or political events. Trading on margin increases the financial risks.
Before deciding to trade in financial instrument or cryptocurrencies you should be fully informed of the risks and costs associated with trading the financial markets, carefully consider your investment objectives, level of experience, and risk appetite, and seek professional advice where needed.
Fusion Media would like to remind you that the data contained in this website is not necessarily real-time nor accurate. The data and prices on the website are not necessarily provided by any market or exchange, but may be provided by market makers, and so prices may not be accurate and may differ from the actual price at any given market, meaning prices are indicative and not appropriate for trading purposes. Fusion Media and any provider of the data contained in this website will not accept liability for any loss or damage as a result of your trading, or your reliance on the information contained within this website.
It is prohibited to use, store, reproduce, display, modify, transmit or distribute the data contained in this website without the explicit prior written permission of Fusion Media and/or the data provider. All intellectual property rights are reserved by the providers and/or the exchange providing the data contained in this website.
Fusion Media may be compensated by the advertisers that appear on the website, based on your interaction with the advertisements or advertisers.
© 2007-2024 - Fusion Media Limited. All Rights Reserved.