Many investors focus on a particular class of assets. Some are interested only in shares, others look exclusively into the real estate. Meanwhile, there are times when market itself highlights an attractive deal; to capitalise on it you need to have some knowledge. Right now a deal has materialised and it can be found in the most ‘detested’ group of assets – commodities.
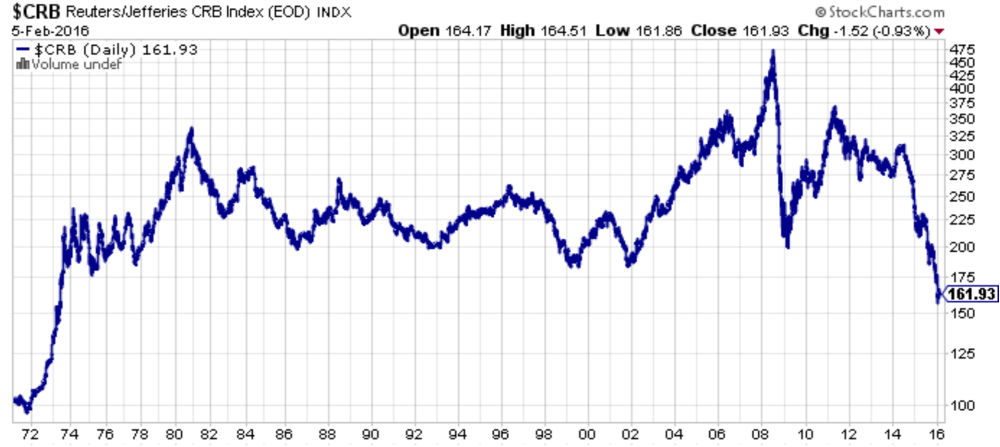
To present situation of commodities we can use various indexes. The oldest one, the CRB, mirrors changes of the 19 most popular commodities. Until 2005 the CRB gave individual commodities – its components – equal share. Since 2005 agricultural commodities have 41%, energy 39%, industrial metals 13% and precious metals 7%. Because of this change index does not illustrate fluctuations in price accurately.

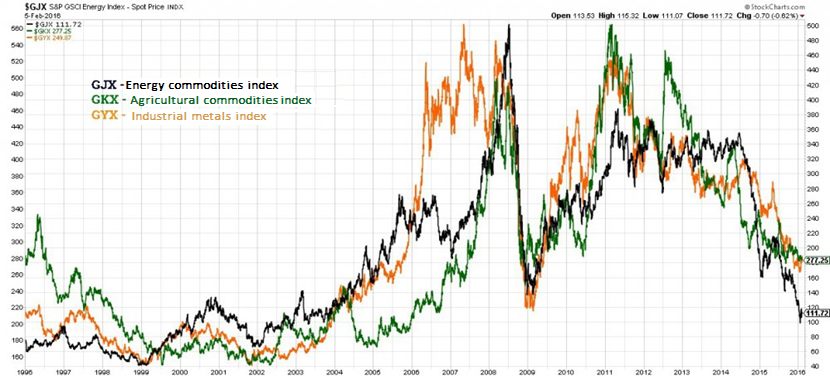
We have many commodity indexes but in general we divide them in three groups:
- Energy commodities,
- Industrial metals,
- Agricultural commodities.
Each group is represented by respective index showed below:
The first thing you should notice is that we have not reached 2002 levels for neither energy nor agricultural commodities yet. Also, here we can point out disproportions when compared to the CRB index.
Nonetheless, due to a global recession and an international trade slump we can see they are cheap. Prices fell so much that further discounts have a limited margin. Right now the mood of investors towards commodities is negative. This is the time we have to answer a simple question: when a global economy shrinks by 3-4% does the world’s industry stop production? Of course not.
In my opinion, today’s low prices are the result of unrelentingly bad sentiment and shorting. The speculative trade in commodities exchanges is multiple times higher than the scale of a real trade.
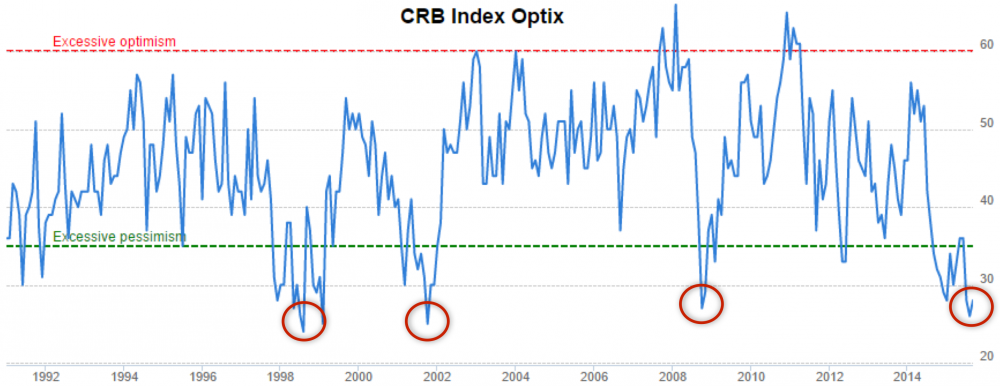
How do investors see commodities?
Source: secularinvestor.com
Nowadays mood of around 73% of investors is negative when it comes to commodities.
Let us investigate what happened in the past when mood was as pessimistic as today:
- 1990 – prices rose by 30%.
- 2002 – 6-year bull market started. It ended with a huge speculative bubble bursting. We saw commodity prices soar by 260% back then.
- 2009 – 2-year boom started during which commodities rose by 80%.
Why an extreme pessimism is a prophet of a climb?
Let us assume we have a situation when an extreme pessimism is widespread. An absolute majority of investors are outside the market. Very small group is exposed to commodities. The mainstream wait on the side-line. At some point, falls stop and huge amount of capital – suspicious before – comes back increasing the price.
We can see this situation reversed when prices record unprecedented highs and market is filled with overly optimistic players. Majority of investors already invested in this group of assets thus, market lacks fresh capital to ramp up prices even higher. Pay attention that we have seen this both in 2008 and 2011 – right before a nosedive started.
Still, extreme levels of both optimism and pessimism are good indicators enabling us to mark peaks and bottoms and to prepare accordingly.
Commodities – a bigger picture
Commodities got my attention after I saw an analogy to 1970s. The US conducted very responsible monetary policy due to limitations of the partial gold standard required until the infamous Bretton Woods conference in 1944.
The situation started to change during 60s when ‘The Great Society’ was implemented and the Vietnam War broke out. Without funds – government warmed up a printing press and started to produce desired money. As a result more dollars entered circulation than gold that backed the US currency.
In 1971 Nixon broke the last link to gold standard and inflation that followed was not the sole result of a resignation from the gold standard but rather an effect of a creation of money during a previous decade. The high inflation made investors to look for alternative methods to store capital – they eyed material assets and it lead to a big commodity boom peaking in 1980.
Today we are seeing similar circumstances. Banks all over the world increase supply of money for 7th year straight. We are not experiencing high inflation – only because the velocity of money circulation is slowing down (as a side-effect of an economic slump). Sooner or later, printed money always catches up and inflates the real economy.
Just like during 70’s we cannot boast many alternatives to store and secure our capital. Stocks and real estate in developed countries are very expensive. We can thank ZIRP (zero-interest-rate-policy) for that. With prices and debt at their respective levels, bonds are a sure loss. Those circumstances may push capital towards commodities just like they did 45 years ago.
Commodity prices today and in 70’s.
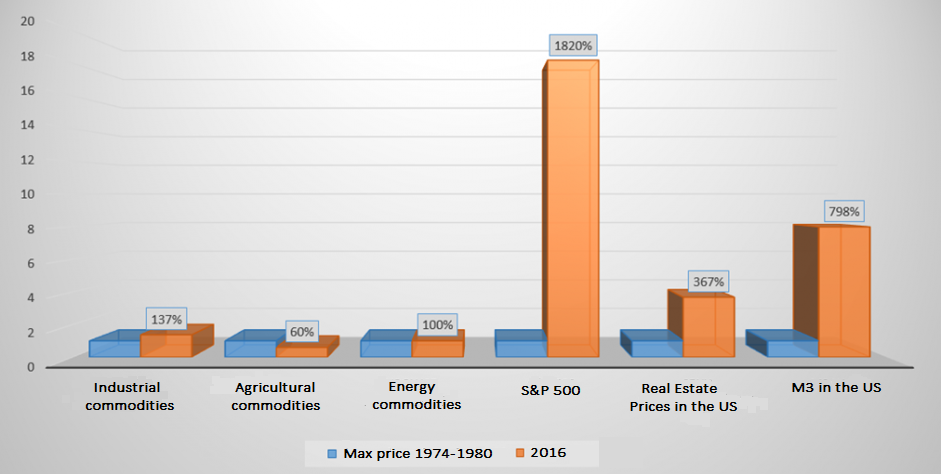
To show the scale of an undervaluation of commodities I compared price/value of respective groups of assets today and in 70s.
.
Source: Self made
In 4 decades stocks in the US rose 17 times. Prices of real estate increased by 270% and supply the M3 money jumped by 700%.
What are commodity prices now?
Taking into account a huge inflation during those four decades prices in terms of US dollars practically stayed the same. What is more, agricultural commodities lost 40%. Meanwhile we saw technological progress putting downward pressure on prices but then how can you explain surge in real estate by 267% when industrial commodities rose only by 37%?
Summary
The prices – of both industrial and energy commodities – have been dropping without any pause since 2011. Today’s levels seriously limit any further reductions. Investment in commodities is not as easy as buying shares or ETFs. The Commodity investment is done by a futures contract or through ETNs. Both are exposed to the contango risk affecting our financial performance. For industrial metals and agricultural commodities it is respectively: 1.8% and 3.7%. For energy commodities, it is equal to a massive 30%!!!
Some alternatives are offered by commodity players – but those companies have a big leverage and this raises red flags. It is true that since 2011 they lost 70-90% of their share price but it is still a gamble between buying a really cheap stock and buying a share in soon-to-file-bankruptcy company. This is a high risk high reward sector with a great potential.
Taking our analysis over to another sector: since mid-January price of gold climbed by 14% (in the USD). Take the same timeframe and junior gold miners (NYSE:GDXJ) – rose by 50%. This is called leverage, ladies and gentlemen. Unfortunately, it works both ways. Remember that when choosing your commodity investment.
