China responded to the latest U.S. tariff increases yesterday with additional tariffs of their own on US imports, which sent markets tumbling with safe haven assets the sole beneficiaries.
Precious metals
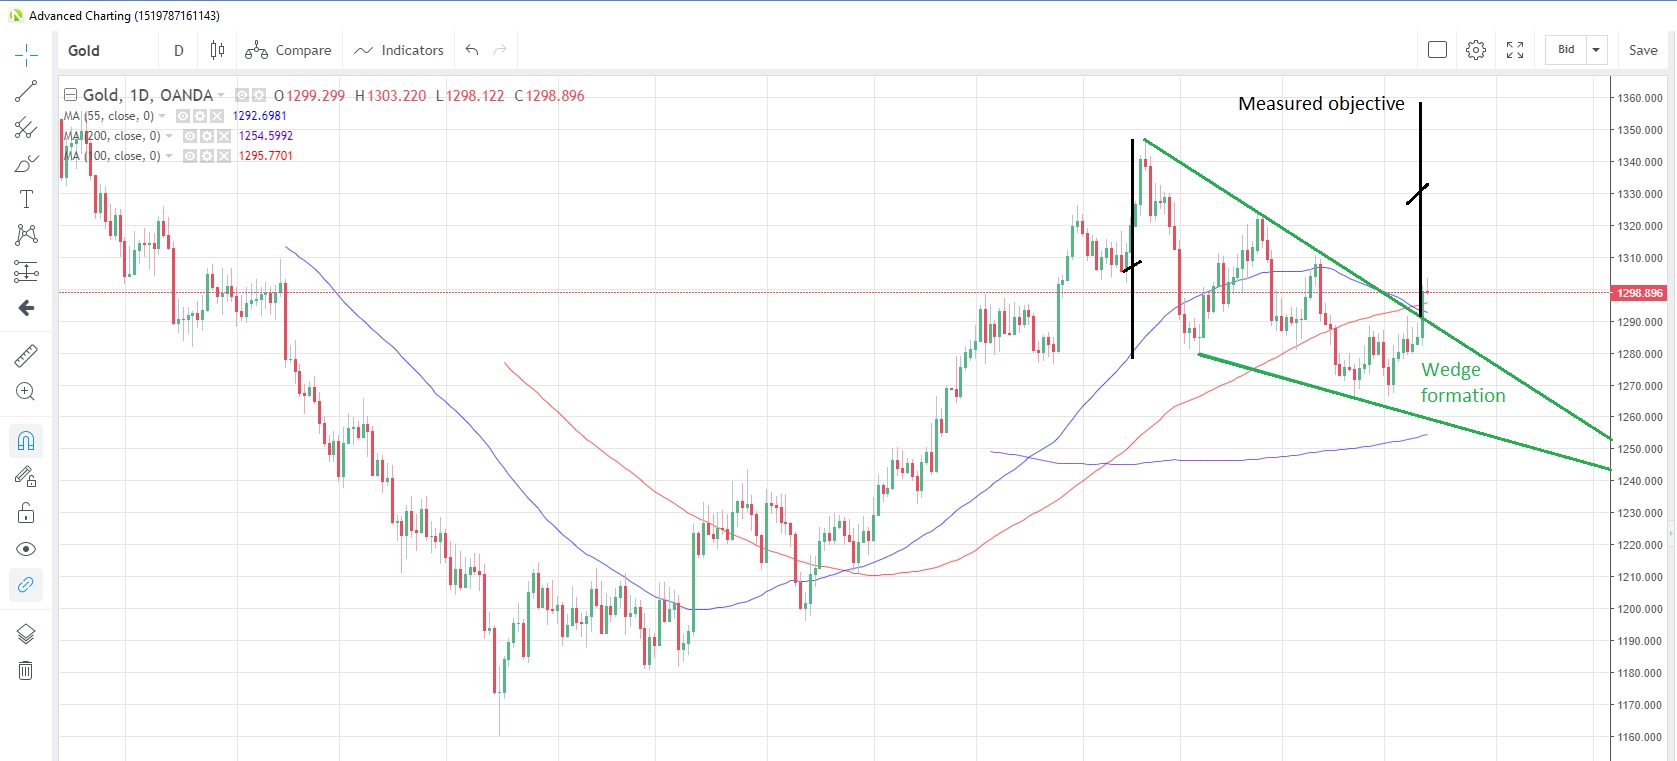
GOLD’s safe haven status was cemented anew as it rallied to the highest in more than a month this morning as the trade tariff war escalated and virtually stepped back to where we were at the start of the year with tit-for-tat tariffs. Gold jumped the most since January 25 yesterday, regained the 1,300 handle and broke out of a chart wedge pattern that had been forming since February. The measured objective of this wedge breakout would come in at around 1,358.
Gold Daily Chart
Source: OANDA fxTrade
Prior to the breakout, speculative investors had added to net long positions for a second straight week in the week to May 7, boosting net longs to the highest since the week of April 9, according to the latest CFTC data. As per last Friday, gold held by Exchange-Traded Funds was the lowest total since December.
SILVER continues to trade below the 200-day moving average, as it has done all month. The gold/silver (Mint) ratio has been catapulted to more than decade highs as gold surged, and is now at 87.80. The lack of upward momentum for silver compared to gold would be pleasing to speculative investors, since net short positioning is at its highest since December.
PLATINUM has been meandering so far this week, with no discernable near-term trend evident. The precious metal is trading between the 100-day moving average support at 838.38 and the 55-day moving average resistance at 863.89. Speculative investors scaled back their bullish bets on the metal from 13-month highs in the week to May 7, the latest data from CFTC shows.
In a report released yesterday, the World Platinum Investment Council stated that a surge in demand from institutional investors has reduced the projected 2019 platinum surplus to 375,000 ounces from 680,000 in March.
PALLADIUM is attempting a rebound from four-month lows this week after posting the biggest one-day gain in more than four years on Friday, which snapped a four-day losing streak. The latest data from CFTC shows that speculative investors reduced net long positions for the first time in three weeks in the week to May 7. The trend of gradually reducing bullish bets started back at the end of February.
Base metals
The deterioration in the US-China trade talks and its impact on future growth and hence raw material consumption has hit COPPER hard, pressing it to the lowest levels since January 29. This month has seen some of the worst daily losses since July/August and the industrial metal is now languishing at 2.7279, just above yesterday’s low of 2.6996.
Speculative investors were net sellers of the metal in the week to May 7, boosting net short positions to the highest since the week of January 29.
Energy
NATURAL GAS is still holding below the 55-day moving average, an average that has capped prices since December 24. Traders are currently weighing forecasts of warmer weather along the US east coast against cooler weather in the west. Last week’s EIA natural gas storage stockpiles showed an addition of 85 billion cubic feet, broadly in line with expectations, and the sixth weekly increase in a row. Economists’ forecasts for this week show an expected addition of 93 billion cubic feet to stockpiles.
A victim of the latest tariff hikes by China is imports of US Liquefied Natural Gas (LNG). Reuters reports that so far this year only two US cargoes of LNG have been shipped to China compared with 14 in the first four months of 2018. China boosted tariffs on LNG to 25% from 10% effective June 1.
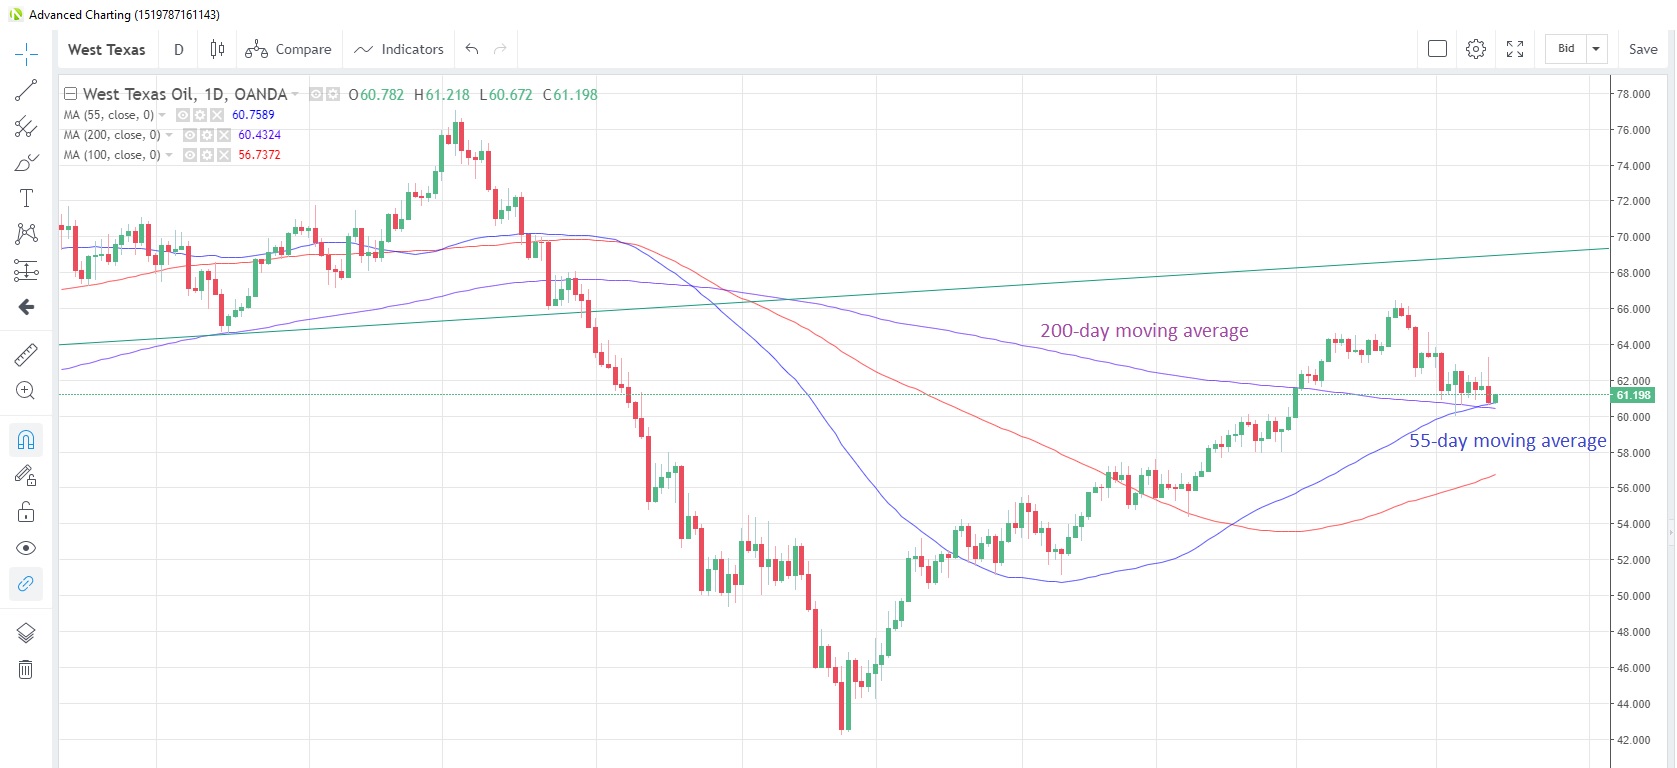
CRUDE OIL prices came under pressure yesterday as China retaliated with tariff increases on US imported goods. West Texas Intermediate (WTI) fell 1.45% to test the 55-day moving average at $60.65. The 200-day moving average is also lurking below at $60.43. WTI is currently trading at $61.08.
WTI Daily Chart
Source: OANDA fxTrade
Prices fell despite reported attacks on two Saudi Arabian tankers in the Persian Gulf. Speculation abounds that Iran had a hand in the affair, and this has raised fears of an escalating conflict in the main oil production area of the world and its consequences for global oil supply.
Speculative investors reduced net long positions for a second straight week in the week to May 7, the latest data snapshot from CFTC shows.
Agriculturals
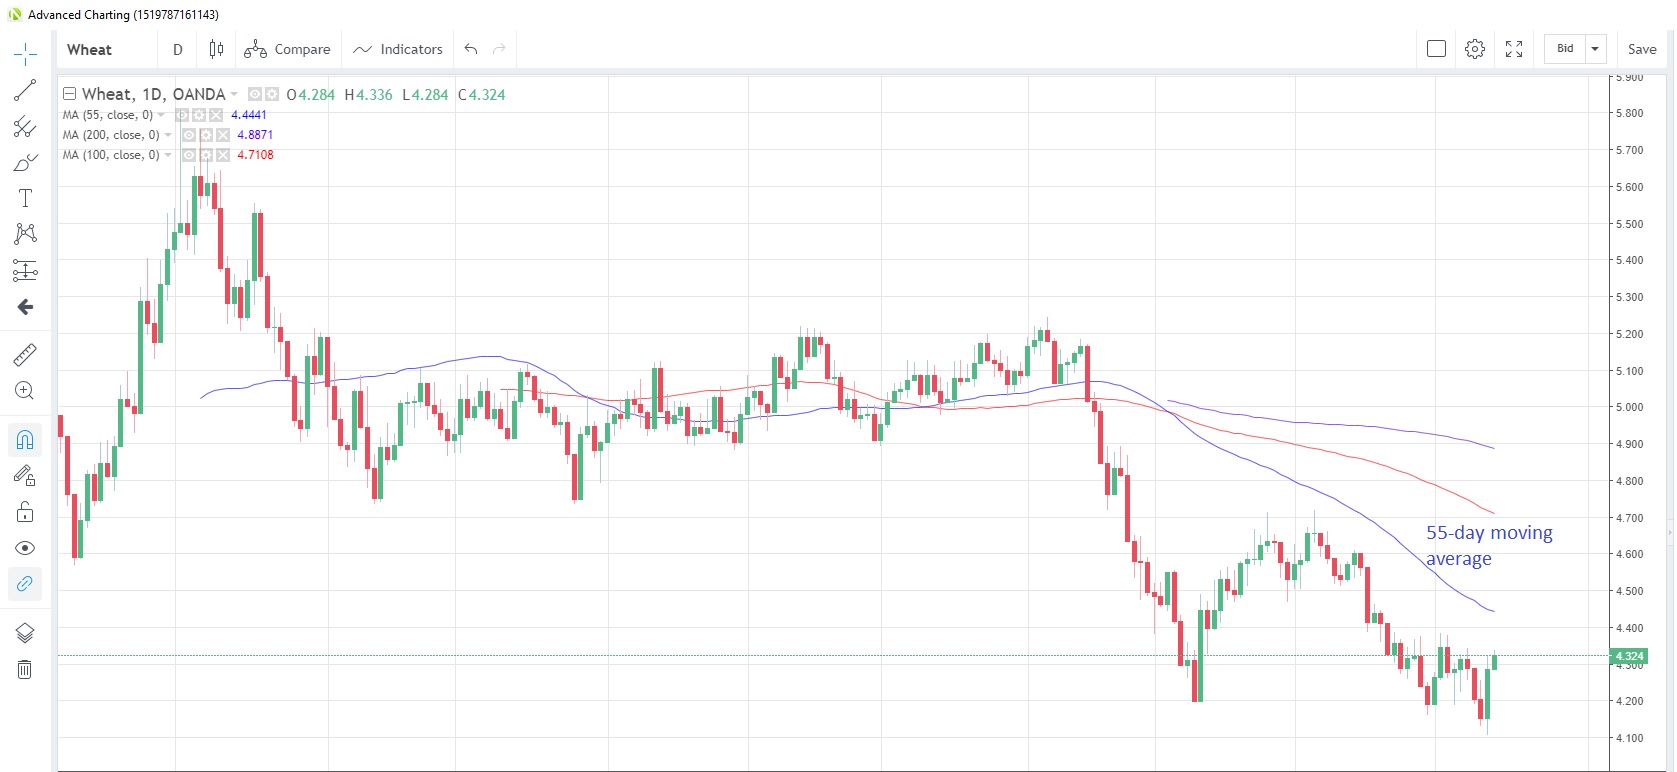
WHEAT looks set to rise for a second straight day today as the commodity rebounds from 16-month lows struck early yesterday. Prices may be eyeing the 55-day moving average at 4.444, which has capped trading since February 14.
Wheat Daily Chart
Source: OANDA fxTrade
The rebound comes despite last Friday’s report from the US Department of Agriculture which forecast US wheat inventories would balloon to a 30-year high in the next season, as more farmers switch away from soy to wheat, which is less dependent on China demand. The same report sees Russian production increasing 7.4% in the same season.
Speculative investors trimmed their net short positions for the first time in four weeks, CFTC data to May 7 shows.
SUGAR prices may also be trying to build a base, with this month’s low so far matching the low seen in January. There may be some supply-side difficulties in the pipeline, with the heavy rains being experienced in Brazil raising fears that export shipments may be delayed. Meanwhile, the USDA report on Friday predicted that India’s sugar output would fall 8.4% in the 2019/20 season which starts in October. US production is seen increasing just 1.9% year-on-year for the same period.
SOYBEAN prices look set to snap a four-day losing streak today, potentially only the second up-day so far this month. Prices touched the lowest in almost a decade yesterday when the 55-day moving average moved below the 200-day moving average for the first time since February 4. Speculative investors reduced net short positioning for the first time in four weeks in the week to May 7, CFTC data shows.
Brazil looks poised to overtake the US as the world’s top soy grower again in the 2019/20 season. The last time this happened was in the 2017/18 season. When it comes to exports however, Brazil has been top of the league above the US since 2012/13.
CORN is also on the rebound after touching eight-month lows yesterday. The upmove comes despite the latest US Department of Agriculture WASDE report predicting bumper US production for the 2019/20 season, with season-end stocks seen up nearly 19% from the previous season. However, exports were seen dropping 2.7% to 36 million tons. Corn is up almost 6% from yesterday’s low and is now at 3.529.


