The USD collapses under the weight of allegations overnight, giving a boost to oil and sending gold soaring as investors dump equities and run for safety.
OIL
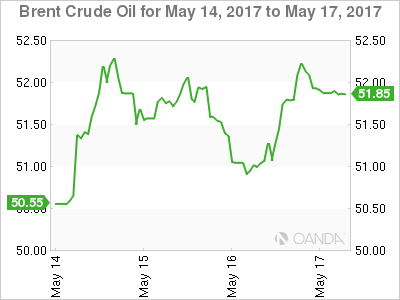
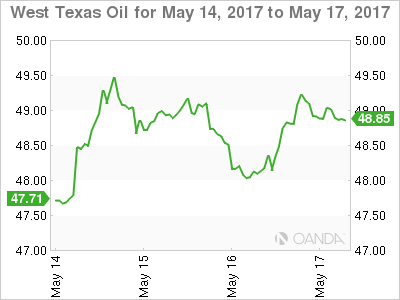
Both Brent and WTI exploded higher overnight, by some 1.80%, despite yesterday's Crude Inventories report showing a lower than expected drawdown. Oil appears to have benefited from a confluence of factors coming together: a weaker U.S. dollar as President Trump’s travails deepen; the largest OPEC producers are indicating they support a production cut extension ahead of next week’s meeting; and finally, a drawdown for six weeks in a row on crude inventories in the U.S. along with drawdowns also seen on gasoline and distillates.
As ever, late session profit-taking saw both crude contracts give back some of their gains with Brent and WTI spot levels opening at 52.00 and 49.00 respectively. However, amongst all the bullish clamoring that's sweeping the market this morning we note a divergence between the Brent and WTI contracts. While Brent has comfortably closed above its 22-day average overnight, WTI has failed to do so. It marks the 3rd day in a row that WTI has broken its 200-day average but has failed to close above it to trigger, a further bullish technical signal. Our best interpretation is the U.S. shale producers are now back in the market selling futures at these levels to hedge future production.
Brent
This morning Brent spot basis has a double top resistance at 52.40 with a general congestion zone of previous daily highs in this region as well. A break above implies a technical move to the 100-day average at 53.50. Intraday support appears at the 50.80 regions and then 50.50.

WTI
WTI spot basis continues to struggle above its 200-day average which sits at 49.10 this morning. Intra-day resistance appears at 49.55 and then 59.85, just ahead of the psychological 50.00 level. Support lies initially at 48.00 and then 47.20.

GOLD
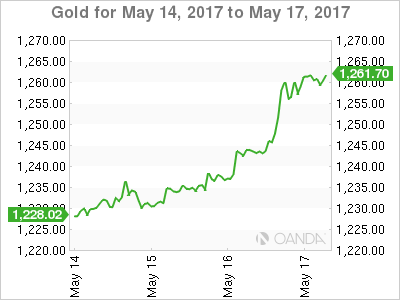
Gold rocketed 30-dollars higher overnight to touch $1261 as investors globally flocked to safety as the political turmoil in Washington D.C. ratchets to new highs on the temperature dial. Gold was the primary beneficiary along with U.S. bonds as investors globally rotated out of equities and the U.S. dollar and fled to safe-havens.
In the process gold has exploded through its 200-day moving average at 1246.60 and trend line resistance at 1257.00 to paint an impressive technical picture this morning in Asia. We do however note, that the move has been driven by a “there’s never just one cockroach” approach to political uncertainty, rather than a fundamental investment reassessment structurally of gold itself. Whilst it is evident the investor world does not like cockroaches, gold itself will now trade on headlines rather than fundamentals, at least for the time being.
This morning, gold trades in Asia at 1260.50 with resistance initially at 1271.00 and then 1295.00. Nearby support sits at 1257.00 followed by 1241.00. Whilst the technical picture looks constructive, traders should monitor their news feeds for near-term direction.

