Talking Points:- Chinese manufacturing gauge at six-year low provoked routs in equities, commodities
- Oil’s fall may intensify below critical levels, global glut unabated
- Copper stressed by Chinese stock rout
- Gold sustained safe haven interests though paused on its climb as commodities dip
Asia Pacific market started the week heavy on risk-off trades following last week’s stock rout and Chinese manufacturing gauge at a six-year low. Gloomy prospect of Chinese economy has provoked massive selling of stocks, commodities and to a lesser extent commodity currencies. Simultaneously, investors rushed to haven assets like USD, JPY, CHF, gold and government bonds.
Shanghai Stock Index opened below the 3500 psychological level and has lost up to 8.56 percent since the previous close, or 5.3 percent during the course of today. This was the highest daily percentage loss since its June sell-off and the recurring stock routs so far have erased all gains made this year. Regional stock markets in Asia also experienced hefty outflows.
Commodity prices set for huge daily losses under the double effect of selling in risky assets and US dollar gains. WTI has lost over 2.55 percent so far in Asian trade, followed by Brent oil at 2.07 percent, and copper at over 2 percent. Chinese stock free fall also intensified losses in commodities amid concerns on Chinese economy.
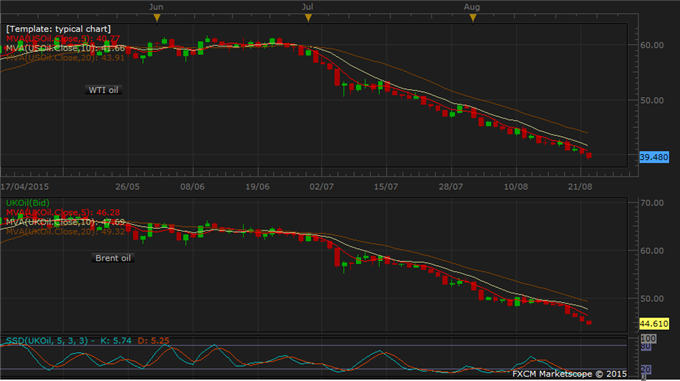
Oil suffered the most with fundamental outlook already weak from a global supply glut and the easing of peak summer demand in the US. Both oil indicators dropped to levels last seen in March 2009. Iran’s oil minister reiterated that the country would expand output at any cost to defend its market share. In the US, number of active oil rigs rose for a fifth straight week according to Barker Hughes, Inc. on Friday.
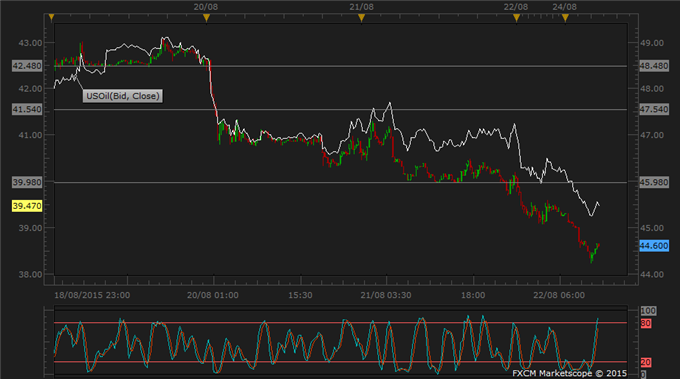
An eighth weekly drop in WTI oil below the $40 mark in previous New York session likely triggered more selling interests as investors hit stop loss and position more shorts. Brent oil’s fall below $45 mark today may prompt similar reaction. There is no hindrance in sight to the downtrend in oil.
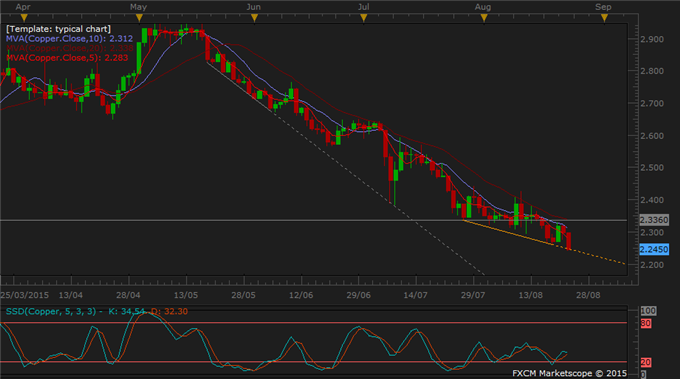
Copper is an apparent victim of the negative sentiment as it is tied to growth of factory activities in China. The metal fell over 2 percent so far and hit a new six-year low together with aluminum.
Copper daily prices have touched down on a support trend line drawn in August (see chart below). The support line may help to hinder bearish momentum, if temporarily.
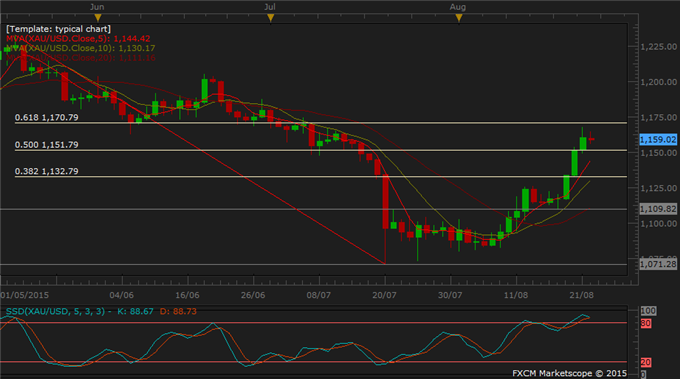
Gold opened higher today on safe haven buying amid a global equity sell-off, although it quickly followed commodity complex on a slide and recorded an insignificant loss of 0.15 percent. Bullion still held the biggest weekly gain since January amid chaotic risky-asset selling and reduced expectations for an imminent US rate rise.
Technical analysis shows gold being contained below the resistance of 61.8% Fibonacci level at 1170.79.
GOLD TECHNICAL ANALYSIS
Gold’s climb paused today ahead of 61.8% Fibo level at 1170.79, although uptrend signal stayed firm. As we have highlighted in previous daily briefings, the gold bulls should exercise caution with daily momentum signals nearing exhaustion (near its upper bound of the range). Possible correction ahead may provide chances for the gold bears to offload their short positions as gold’s outlook focuses on the upside.

COPPER TECHNICAL ANALYSIS
Copper touched down on an August support trend line today and currently threatens to dip below it. The trend line may offer some divergence to downward momentum and help to contain further down moves. Downtrend signal persists in moving averages and the bears may watch out for a break below the line to add more shorts.

CRUDE OIL TECHNICAL ANALYSIS
No change has emerged in downtrend signals for both WTI and Brent oil, although their intraday chart displayed early signs of a pick-up just after Asian noon time. If this carries on to form an intraday rebound, the ensuing volatility would provide some opportunities to intraday traders.


