Get 40% Off
🤯 Perficient is up a mind-blowing 53%. Our ProPicks AI saw the buying opportunity in March.Read full update

Chart Of The Day: Bad Breadth For Commodities

Published 04/30/2017, 12:10 AM
Updated 07/09/2023, 06:31 AM

Commodity market breadth measures show a market that looks vulnerable. The below charts apply market breadth measures to the GSCI (Light Energy) Commodities Index by examining what proportion of its components are above their respective 50-day and 200-day moving averages. The first thing to note is what is referred to as "bearish divergence" with the index making higher highs but the 200-day moving average breadth indicator making lower highs. This type of pattern often occurs at significant market turning points. The second point is that 50-day moving average breadth has deteriorated notably.

The global macro backdrop for commodities has improved significantly since the bottom back at the start of 2016, with the rebound in China and emerging markets a fundamental driving force in the recovery. At the same time some of the appreciation pressures for the US dollar have waned. So it is possible that these indicators below may be calling time on these positive macro-dynamics. It also reflects a more mixed and idiosyncratic outlook for individual commodities e.g. in the latest edition of the Weekly Macro Themes report we outlined the case for a bearish medium term view on gold, and short-term upside risk in grains.

Bearish breadth divergence for commodities: not necessarily a show-stopper but it is a warning sign.
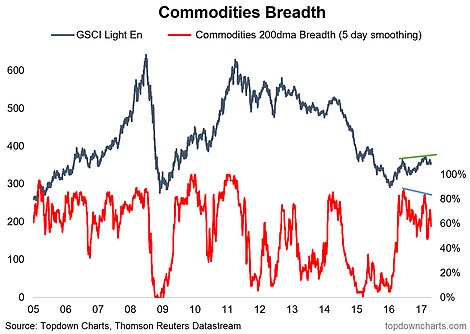
GSCI Light En. vs Commodities 200DMA  2005-2017

Commodity breadth on the 50-day moving average time frame has deteriorated to soft levels.
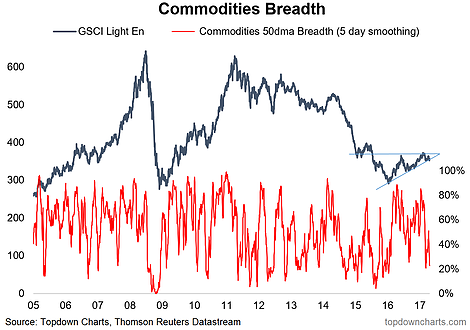
GSCI Light En. vs Commodities 50DMA  2005-2017

Latest comments

Risk Disclosure: Trading in financial instruments and/or cryptocurrencies involves high risks including the risk of losing some, or all, of your investment amount, and may not be suitable for all investors. Prices of cryptocurrencies are extremely volatile and may be affected by external factors such as financial, regulatory or political events. Trading on margin increases the financial risks.
Before deciding to trade in financial instrument or cryptocurrencies you should be fully informed of the risks and costs associated with trading the financial markets, carefully consider your investment objectives, level of experience, and risk appetite, and seek professional advice where needed.
Fusion Media would like to remind you that the data contained in this website is not necessarily real-time nor accurate. The data and prices on the website are not necessarily provided by any market or exchange, but may be provided by market makers, and so prices may not be accurate and may differ from the actual price at any given market, meaning prices are indicative and not appropriate for trading purposes. Fusion Media and any provider of the data contained in this website will not accept liability for any loss or damage as a result of your trading, or your reliance on the information contained within this website.
It is prohibited to use, store, reproduce, display, modify, transmit or distribute the data contained in this website without the explicit prior written permission of Fusion Media and/or the data provider. All intellectual property rights are reserved by the providers and/or the exchange providing the data contained in this website.
Fusion Media may be compensated by the advertisers that appear on the website, based on your interaction with the advertisements or advertisers.
© 2007-2024 - Fusion Media Limited. All Rights Reserved.