Several authors have pointed out the difficulties in fashioning trades to take advantage of the movement in oil prices (for a recent example, see “Is Gasoline The Smart Oil Play? UGA Vs. USO“). Analyses counting off the bullish and bearish arguments on oil can fill many tomes. For example, there is fear of a drop in Chinese demand, renewed builds in inventory, and a painfully slow adjustment process on the supply-side.
The main positive catalyst to consider is that the negative catalysts cannot get much worse. One of the most recent twists on the oil-related headlines is Morgan Stanley’s warning regarding the potential for a complete collapse in oil prices. It invoked images worse than the crash of 1986.
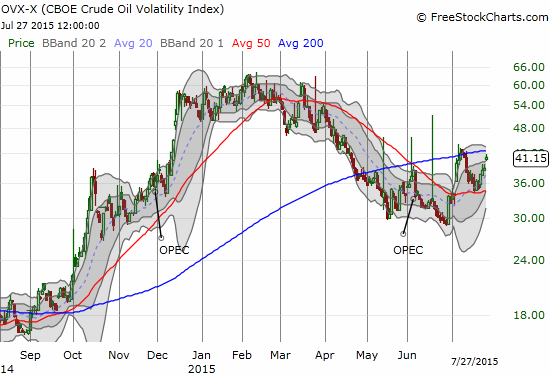
The reporting in the Bloomberg article pointed out that surprisingly, OPEC has ramped up production ever higher even as fundamentals in the market do not appear to support the additional supply. The article includes a chart showing that OPEC now supplies a full 1 million barrels per day above and beyond the peak from 2014. Morgan Stanley) thinks that OPEC is now stretched to the max. However, if Iran and Libya pile on along with ongoing run-ups in U.S. production then “there would be little in analysable history that could be a guide for what’s to come.” This kind of looming fear is presumably behind the recent revival in OVX.
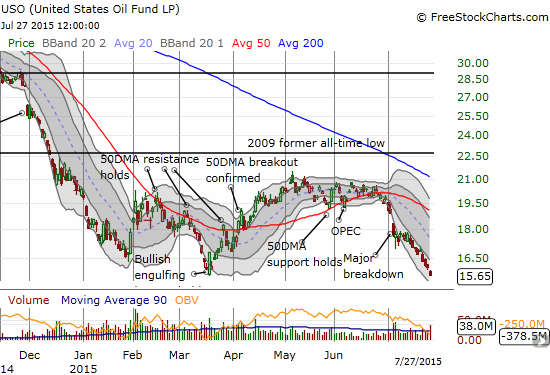
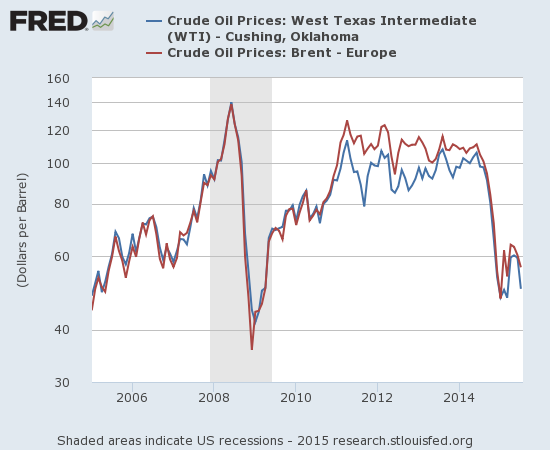
Through all the headlines, one bet continues to perform up or down – using options on the United States Oil ETF (NYSE:USO) to bet on the rangebound performance of oil. I first described this bet in March. In early June, I provided an update to show the profitability of the trade as the rally off all-time lows stalled for the United States Oil ETF (USO). Now USO is challenging its all-time low again as (WTI) oil runs into the lows from March. Those lows in turn were levels last seen during the recession.

United States Oil ETF (USO) is now challenging what had looked like a sustainable bottom
Source: FreeStockCharts.com

If recent lows on oil break, the next stop could very well be the lows from the last recession.*
I have chosen this tension-filled moment of increasing volatility to get on board with the rangebound trade. I provide here a refresher on the trade and another update on performance.
After I laid out my “simple scenarios” for trading the United States Oil ETF (USO) in mid-June, the base case of trading around the 50-day moving average (DMA) – consistent with the assumption of rangebound oil – lasted for just 8 trading days. A 16% spike in the CBOE Crude Oil Volatility Index (OVX) on June 29th launched the bearish conditional on the simple trade. USO “only” lost 2.4% that day and almost reversed all its losses the next day.
It was not until a massive breakdown on July 6th that USO delivered confirmation of the bearish bias. OVX also closed above its pre-OPEC level and provided final confirmation of the bearish bias for USO per my simple scenarios.

The CBOE Crude Oil Volatility Index (OVX) is on the rise again and is threatening to break out.
Source: FreeStockCharts.com
It now appears OVX will remain elevated. A new uptrend will be in place if OVX breaks out above 44 or so. If such a breakout occurs, I will quickly move to trading an inverse oil bet like ProShares UltraShort Bloomberg Crude Oil (ARCA:SCO) or even shorter-term put options until OVX ends the uptrend.
The original rangebound trade had the great advantage of selling put and call options right around the time OVX peaked; thus, the trade sold short hefty option premiums. That advantage shows in the results: with USO a bit below the levels where the trade was executed, the short January $19 and $20 2017 options have combined to deliver profits. The calculations below compare approximate option prices on March 5, 2015 versus prices on July 27, 2015.
Jan 2017 USO call options sold short
- $19 Call: $3.42 vs $1.75 = gain of $1.67 or 49%
- $20 Call: $2.95 vs $1.47 = gain of $1.35 or 50%
Jan 2017 USO put options sold short
- $19 Put: $3.50 vs $4.85 = loss of $1.00 or 39%
- $20 Put: $4.06 vs $5.50 = loss of $1.11 or 35%
For comparison, the net profit spread on this trade was around 15% on May 29th. Now, it is 10%. This 5% drop in the spread has occurred while USO has plunged 23%. This behavior is a feature, not a bug. Long-dated rangebound trading should perform within a tight window in the short-term since it is not a directional bet. Over the course of time, the gains should expand with greater speed if all is working according to plan.
In finally executing my own rangebound trade, I am first assuming that USO will NOT drop another 23% in two months. That would be the rough equivalent of oil dropping to or below $40, close to the recession lows as shown above.
As a precaution, I started off my trade small anyway (after all, OVX is still well off its high this year). I sold equal amounts of January 2017 $15 put options versus January 2017 $19 call options. I picked $19 as the upside target given it coincides with the current level of the now declining 50DMA. I did not sell the same strike for the call options as the put options, to reflect my bias that odds favor USO to trade higher than lower many months down the road.
I also capped extreme losses from a massive and sudden upside surprise on USO by buying well out-of-the money USO call options. This slightly reduces profit potential but greatly increases comfort.
(For more context on my interest in trading commodities in the middle of an accelerating crash, see here).
Be careful out there!
Full disclosure: short USO put options, long and short USO call options
* Sources for FRED chart, above: US. Energy Information Administration, Crude Oil Prices: West Texas Intermediate (WTI) – Cushing, Oklahoma [DCOILWTICO], retrieved from FRED, Federal Reserve Bank of St. Louis, July 27, 2015.
US. Energy Information Administration, Crude Oil Prices: Brent – Europe [DCOILBRENTEU], retrieved from FRED, Federal Reserve Bank of St. Louis, July 27, 2015.
