
Cognizant Technology Solutions Corp. (NASDAQ:CTSH) reported third-quarter 2017 non-GAAP earnings of 98 cents per share, which beat the Zacks Consensus Estimate by 3 cents and increased nearly 14% from the year-ago quarter. The figure was better than management’s expectation of 94 cents.
Revenues of $3.77 billion were in line with the Zacks Consensus Estimate but increased 9.1% year over year driven by growth across all the four domains. The figure came in within the guided range of $3.73–$3.78 billion.
Cognizant raised the lower end of its revenue guidance for 2017, which reflects improved visibility. Moreover, the company raised its earnings guidance. We believe that the results and the guidance indicate the company’s ability to harness the ongoing digital transition.
Cognizant is benefiting from accretive acquisitions. The company also announced its plans to acquire Netcentric and Zone in the fourth quarter.
Cognizant’s strong growth can be attributed to its significant exposure to fast-growing verticals like Financial Services and Healthcare. Robust growth in the company’s Products & Resources segment along with its Communications, Media and Technology segments boosted its top line.
Moreover, the company has gained deep industry expertise and knowledge of the domains through partnerships with top firms like Microsoft (NASDAQ:MSFT) and SAP SE (NYSE:SAP) .
This strategy has enabled the company to deliver more value to clients and capitalize on new opportunities. It has also provided a competitive edge against the likes of Accenture (NYSE:ACN) , Infosys and Wipro Ltd.
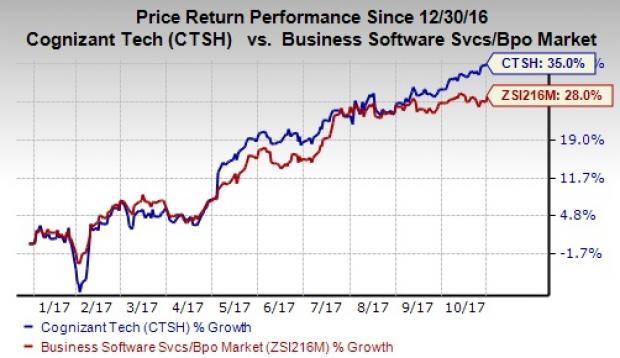
Cognizant’s stock has gained 35% year to date, significantly outperforming the 28% rally of the industry it belongs to.
Quarter Details
Segment-wise, Financial services (37.9% of revenues), which includes insurance, banking and transaction processing, grew 3.8% year over year to $1.43 billion. The segment was driven by growth in insurance companies and mid-tier banks, which offset the softness arising from large banks.
Healthcare (28.8% of revenues) grew 9.3% year over year to $1.09 billion. Notably, Cognizant completed the acquisition of TMG Health in August, which enabled it to expand its healthcare offerings and thereby cater to growing demand from its payer clients.
Products and Resources (20.6% of revenues) continued its growth momentum and surged 14% year over year to $774 million driven by growth in manufacturing, logistics, energy and utilities clients.
Communications, Media and Technology (12.7% of revenues) were $480 million, up 18.2% from the year-ago quarter.
Region-wise, revenues from North America increased 6.7% year over year and represented 76.8% of total revenues.
Revenues from the United Kingdom increased 2.7% year over year (8% of the total revenue). Rest of Europe continued to show strength with revenues soaring 34% from the year-ago quarter. As a result, Europe revenues increased 16.9% from the year-ago quarter to $628 million.
Rest of the World (6.6% of the total revenue) surged 19.9% to $247 million.
Selling, general & administrative (SG&A) expenses, as a percentage of revenues, contracted 240 basis points (bps) from the year-ago quarter to 17.9%.
Cognizant reported non-GAAP operating margin of 20%, which expanded 70 bps from the year-ago quarter.
In the quarter ended Sep 30, 2017, cash and cash equivalents (and short-term investments) were $4.71 billion.
Cognizant Technology Solutions Corporation Price
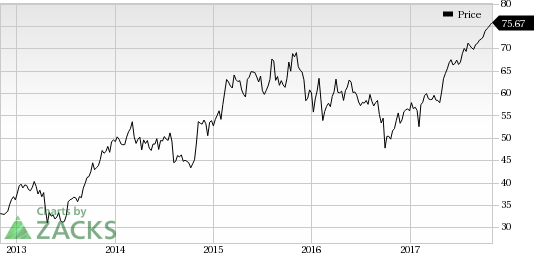
Cognizant Technology Solutions Corporation Price | Cognizant Technology Solutions Corporation Quote
Guidance
For the fourth quarter of 2017, Cognizant expects revenues in the range of $3.79–$3.85 billion. Non-GAAP earnings are expected to be 95 cents per share. The Zacks Consensus Estimate for revenues and earnings is pegged at $3.82 billion and 98 cents, respectively.
Revenues for fiscal 2017 are now expected to be in the range of $14.78–$14.84 billion, compared with the prior guided range of $14.70–$14.84 billion. Non-GAAP earnings are anticipated to be $3.70 per share, up from the prior expectation of $3.67.
The Zacks Consensus Estimate for revenues and earnings is pegged at $14.79 billion and $3.70 per share, respectively.
Zacks Rank
Currently, Cognizant has a Zacks Rank #2 (Buy). You can see the complete list of today’s Zacks #1 Rank (Strong Buy) stocks here.
More Stock News: This Is Bigger than the iPhone!
It could become the mother of all technological revolutions. Apple (NASDAQ:AAPL) sold a mere 1 billion iPhones in 10 years but a new breakthrough is expected to generate more than 27 billion devices in just 3 years, creating a $1.7 trillion market.
Zacks has just released a Special Report that spotlights this fast-emerging phenomenon and 6 tickers for taking advantage of it. If you don't buy now, you may kick yourself in 2020.
Click here for the 6 trades >>
Cognizant Technology Solutions Corporation (CTSH): Free Stock Analysis Report
Microsoft Corporation (MSFT): Free Stock Analysis Report
SAP SE (SAP): Free Stock Analysis Report
Accenture PLC (ACN): Free Stock Analysis Report
Original post