Revenues, operating income, net income and earnings before interest, depreciation and amortization and income tax expenses (EBITDA) reported by Buckeye Partners L.P. (BPL) for 4Q12, 4Q11 and for 2010-2012 are summarized in Table 1 below: 
The decrease in 2012 revenues is primarily attributable to a $596 million decline in net sales volume for the Energy Services segment, which was partially offset by a significant revenue increase in the Pipelines and Terminals segment, as well as by increased storage revenue as a result of 1.9 million barrels of incremental storage capacity brought online at BORCO in the second half of 2012. Pipelines and terminals benefited primarily from the impact of recent acquisitions, including the assets acquired from BP and ExxonMobil in mid-2011 and the Perth Amboy Facility acquired in the second half of 2012.
The favorable comparison of operating income and net income numbers for 2012 primarily results from a $170 million goodwill impairment charge for the Lodi acquisition in 3Q11. Also, as previously noted, 2012 results include partial contributions from Perth Amboy and the BORCO expansion, which are absent from the 2011 numbers.
Adjusted EBITDA is the primary measure used by BPL’s management to evaluate each business segment, overall performance, resource and capital allocation, and the viability of, and rates of return on, proposed projects. Adjusted EBITDA improved significantly in 2012 compared to 2011. Contributions to Adjusted EBITDA by segment are presented in Table 2 below: 
Management noted that improved 2012 operating performance as measured by Adjusted EBITDA was primarily driven by a full period of operating activities for 2011 acquisitions, the benefit of contributions from growth capital spending and higher blending capabilities, particularly butane blending, in the Pipelines & Terminals segment, as well as increased storage capacity and customer utilization of the BORCO facility in the International Operations segment.
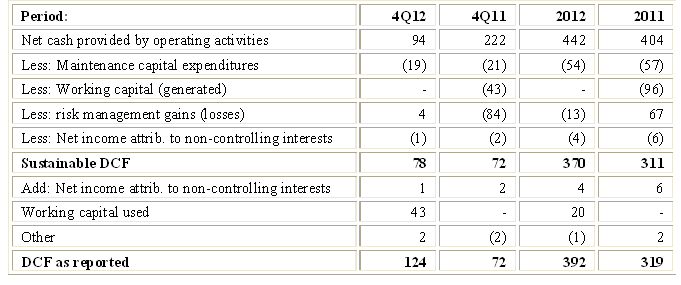
BPL’s definition of Distributable Cash Flow (“DCF”) and a comparison to definitions used by other master limited partnerships (“MLPs”) are described in an article titled Distributable Cash Flow (“DCF”). Using that definition, DCF for 2012 was $393 million ($4.02 per unit), up from $319 million ($3.51 per unit) in 2011.
As always, I first attempt to assess how these DCF figures compare with what I call sustainable DCF for these periods and whether distributions were funded by additional debt or issuing additional units. Given quarterly fluctuations in revenues, working capital needs and other items, a review of trailing 12 months (“TTM”) or annual numbers tends to be more meaningful than quarterly numbers for the purpose of analyzing changes in reported and sustainable distributable cash flows. However, I present both.
The generic reasons why DCF as reported by the MLP may differ from sustainable DCF are reviewed in an article titled Estimating sustainable DCF-why and how. Applying the method described there to RGP’s results generates the comparison outlined in Table 3 below: 
The main differences between reported and sustainable DCF relate to working capital.
Under BPL’s definition, reported DCF always excludes working capital changes, whether positive or negative. In contrast, as detailed in my prior articles, I generally do not include working capital generated in the definition of sustainable DCF but I do deduct working capital invested. Despite appearing to be inconsistent, this makes sense because in order to meet my definition of sustainability the master limited partnerships should, on the one hand, generate enough capital to cover normal working capital needs. On the other hand, cash generated from working capital is not a sustainable source and I therefore ignore it. Over reasonably lengthy measurement periods, working capital generated tends to be offset by needs to invest in working capital. I therefore do not add working capital consumed to net cash provided by operating activities in deriving sustainable DCF. Cash consumed by working capital accounts for $20 million of the $22 million variance between reported and sustainable DCF in 2012 vs. 2011.
Coverage ratios for are presented in Table 4 below: 
While both reported and sustainable DCF increased in absolute terms in 4Q12 and 2012 vs. the comparable prior year periods, BPL continues to exhibit low coverage ratios. Management reported 1.32x distribution coverage for 4Q12 and 1.04x for 2012, but as previously noted this ignores having needed to provide $20-43 million of additional working capital. I believe it is more meaningful to look at coverage ratios over longer periods and not to back out of the sustainable DCF calculation investments required to be made in working capital.
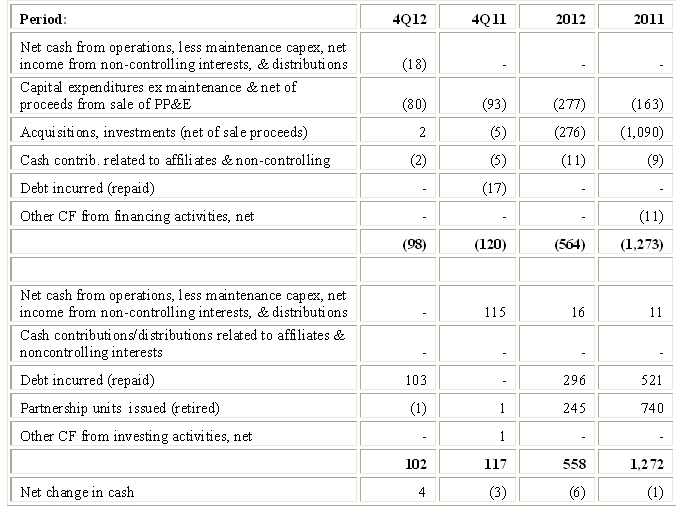
I find it helpful to look at a simplified cash flow statement by netting certain items (e.g., acquisitions against dispositions) and by separating cash generation from cash consumption. Here is what I see for BPL:
Simplified Sources and Uses of Funds 
Table 5 indicates $16 million of net cash from operations remained in 2012 after deducting maintenance capital expenditures and distributions. The corresponding figure for 2011 was $11 million. In those periods, BPL did not fund distributions by issuing debt and/or equity. But unlike some of the other MLPs I cover, it has not generated a cash cushion of any meaningful amount.
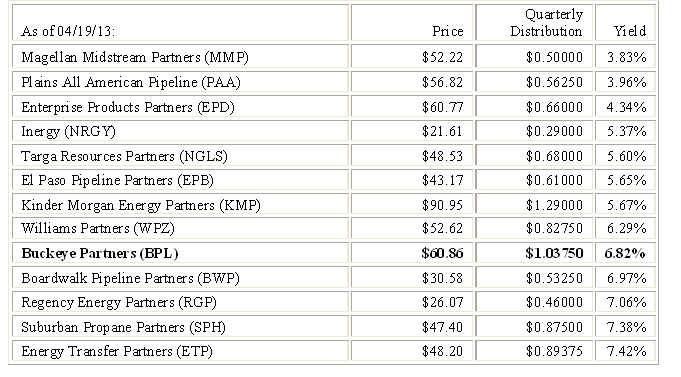
BPL’s current yield has come down significantly as a result of unit price appreciation since the 4th quarter of 2012. A comparison to some of the other MLPs I follow is shown in Table 6 below: 
BPL expects to spend a total of ~$330 million on expansion and cost reduction projects in 2013. As noted, BPL has not been generating excess cash which could help fund these capital expenditures and must therefore fund them with debt, equity or asset sales. It had only ~$7 million cash on the balance sheet and long-term debt that, at $2.7 billion, is already at 5.6x EBITDA and 4.9x Adjusted EBITDA as of 12/31/12. Given that, I believe it is likely BPL will issue additional equity, further diluting current limited partners. Otherwise I don’t see how it can fund expansion projects in 2013. Sale of the Natural Gas Storage business will reduce the amount of equity required to be raised but management reports no progress on this front and it is not possible to predict whether, and at what price, a sale will occur.
Also still of concern is the Federal Energy Regulatory Commission (FERC) order of March 30, 2012, that disallowed proposed rate increases on the Buckeye System that would have become effective April 1, 2012. The proposed rate increases were expected to increase BPL’s annual revenues (and, I presume, EBITDA) by approximately $8 million. But if forced to resort to FERC’s generic rate setting mechanism, the adverse impact goes well beyond forgoing this increase and could have a substantial adverse affect on BPL because it would lower tariffs on pipelines that account for ~70% of BPL’s revenues. Uncertainty remains even post the February 22, 2013 Ratemaking Methodology Order issued by FERC as to the impact on future changes to BPL’s rates in markets outside the New York City market. In addition, the ultimate resolution of the complaint of certain airlines regarding jet fuel rates to the three major New York City area airports could impact rates to those destinations. This is a major issue overhanging BPL.
I held BPL units for many years and eliminated my position in light of the issues highlighted in my prior articles. Thirty two consecutive quarterly increases in distributions per unit ended in 1Q12 with distribution unchanged at $1.0375 per unit. This has been the distribution level for the past 5 consecutive quarters. Despite positives such as a 6.8% yield and the absence of general partner incentive distribution rights, I am not currently considering reestablishing a position because of concerns discussed in this and prior articles. These include low distribution coverage, expensive acquisitions, past and prospective unitholder dilution, as well as the FERC risk.
- English (UK)
- English (India)
- English (Canada)
- English (Australia)
- English (South Africa)
- English (Philippines)
- English (Nigeria)
- Deutsch
- Español (España)
- Español (México)
- Français
- Italiano
- Nederlands
- Português (Portugal)
- Polski
- Português (Brasil)
- Русский
- Türkçe
- العربية
- Ελληνικά
- Svenska
- Suomi
- עברית
- 日本語
- 한국어
- 简体中文
- 繁體中文
- Bahasa Indonesia
- Bahasa Melayu
- ไทย
- Tiếng Việt
- हिंदी
Closer Look: Buckeye Partners
Published 04/22/2013, 08:44 AM
Updated 07/09/2023, 06:31 AM
Closer Look: Buckeye Partners
3rd party Ad. Not an offer or recommendation by Investing.com. See disclosure here or
remove ads
.
Latest comments
Install Our App
Risk Disclosure: Trading in financial instruments and/or cryptocurrencies involves high risks including the risk of losing some, or all, of your investment amount, and may not be suitable for all investors. Prices of cryptocurrencies are extremely volatile and may be affected by external factors such as financial, regulatory or political events. Trading on margin increases the financial risks.
Before deciding to trade in financial instrument or cryptocurrencies you should be fully informed of the risks and costs associated with trading the financial markets, carefully consider your investment objectives, level of experience, and risk appetite, and seek professional advice where needed.
Fusion Media would like to remind you that the data contained in this website is not necessarily real-time nor accurate. The data and prices on the website are not necessarily provided by any market or exchange, but may be provided by market makers, and so prices may not be accurate and may differ from the actual price at any given market, meaning prices are indicative and not appropriate for trading purposes. Fusion Media and any provider of the data contained in this website will not accept liability for any loss or damage as a result of your trading, or your reliance on the information contained within this website.
It is prohibited to use, store, reproduce, display, modify, transmit or distribute the data contained in this website without the explicit prior written permission of Fusion Media and/or the data provider. All intellectual property rights are reserved by the providers and/or the exchange providing the data contained in this website.
Fusion Media may be compensated by the advertisers that appear on the website, based on your interaction with the advertisements or advertisers.
© 2007-2024 - Fusion Media Limited. All Rights Reserved.
