In the past several weeks we have discussed the possibility of a market that may be getting ready to trend lower. The question that many are asking is whether this is a “normal” type of a pull back or if it is turning into a reversal and if we will continue to see bearish movements going forward. While we can’t say for sure what is going to happen, we can look at the charts to see if there is evidence supporting further downward movement.
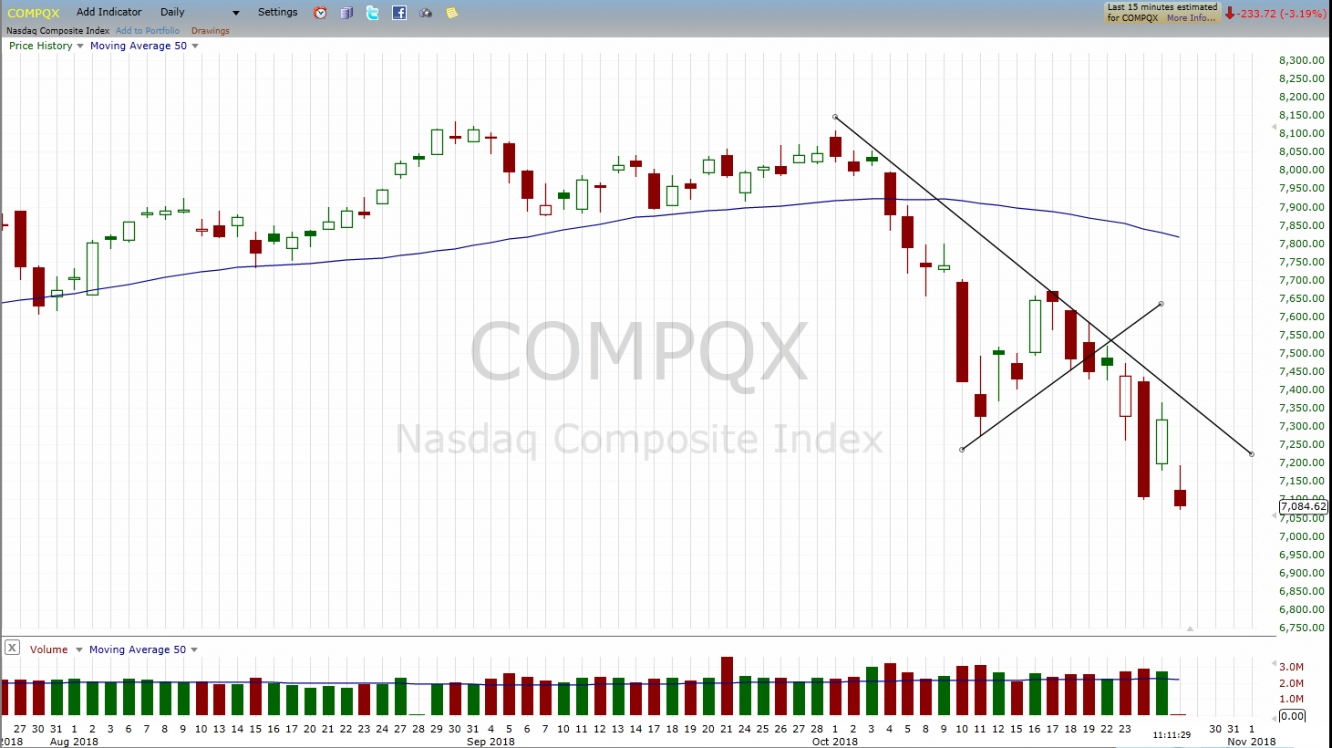
One of the key elements in analyzing charts is to define the trend. Many trades use this information to decide if they will be buying or selling. In today’s chart (below) of the NASDAQ Composite we can see a couple of “signs” that point to a more bearish direction. First, on this chart we have the 50 period simple moving average (blue line) which began to turn down a couple of weeks ago. This moving average is showing that the price action happening over the last 50 days has been more bearish than it has been bullish. The second thing we can see is that the price broke below the triangle price pattern that we drew on the chart. A triangle price pattern happens when the price slows down and consolidates. This consolidated movements can be seen as sideways movements, small pull backs or other price patterns such as flag, wedges and triangles. In this case, the lower support area of the triangle has been broken. The final thing we will point out is that the price has put in a lower high as well as a lower lows, both of which suggest price is trending down.
With these three things we see happening on the chart, there is evidence that this is more than just a pull back. While we don’t know how long it will continue, we do know it’s not just a quick move lower.
1. NASDAQ:
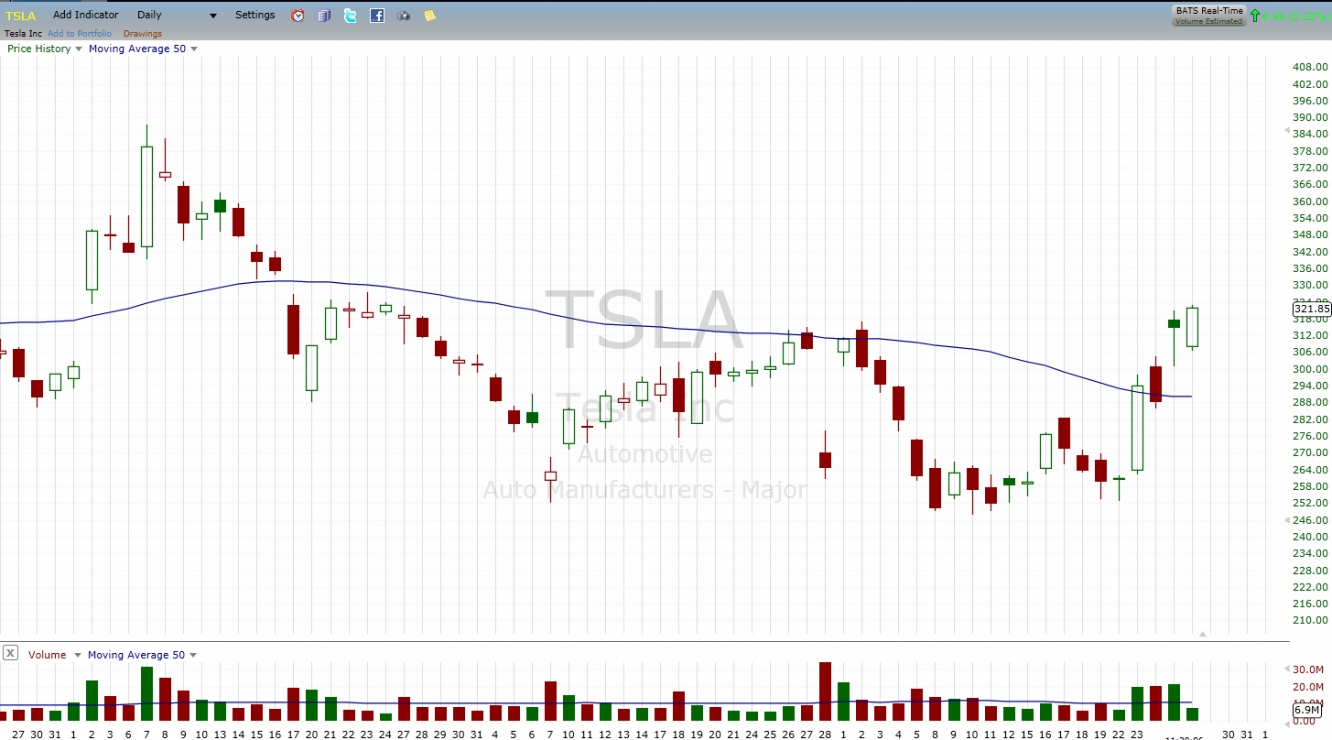
The next chart we want to look at is that of Tesla (NASDAQ:TSLA). There has been plenty of interesting news surrounding Tesla and Elon Musk this past month that has cause some significant volatility in the price action. Most recently though, Tesla reported that they actually turned a profit in this last quarter. This news causes a nice move up in the price. Take a look at the chart below.
TSLA:
There are a couple of elements that we should point out on this chart. First, the 50 period simple moving average is moving down. Like we suggested above, this is telling us price has been more bearish. Second, even though the moving average is pointing lower, price has shown some strength the last few days. This move higher has done a couple of things that would suggest a move higher. The first thing that price did was it broke above the moving average. This is a sign of bullish momentum. The second thing is it put in a new higher low as well as a higher high. Both of these are signs of bullish strength.
While we know one quarter of positive earnings does not mean all is well with Tesla, it is a good signal that the stock is strong. That, along with the signs of bullish strength on the charts suggests that there may be some additional bullish movements in this stock.
Finally, whenever the markets are putting in unusually wide range trading day, especially multiple days in a short time frame, we need to make sure we are using good risk management. This may mean we step aside until the markets become more deliberate or we just cut back on the amount we are willing to risk in our trades. Whatever you decide to do, just make sure you are patient and enter trades with the understanding that the markets are currently a bit more volatile. Also, be assured that this is only a temporary thing and that the markets will once again become more deliberate in how they move.


