Get 40% Off
🎁 Free Gift Friday: Copy Legendary Investors' Portfolios in One ClickCopy for Free

The Clean Energy ETF That Soared 20% Already This Year

Published 08/02/2020, 12:38 AM
Updated 07/09/2023, 06:31 AM

As a technician, I like to see what stocks are moving. Uptrends, breakouts, bullish chart patterns are all tools in the toolbox. Utilities stocks, as measured by the Utilities Select Sector SPDR® Fund (NYSE:XLUsector ETF, are doing a whole lot of nothing this year, so I must look elsewhere.

Look no further than the renewable energy space. Two of the common ETFs are the Invesco Solar ETF (NYSE:TANand the First Trust Global Wind Energy ETF (NYSE:FAN). Both charts appear to be in uptrends with some bullish features. I want to take a broader look, though – there’s an ETF for that.
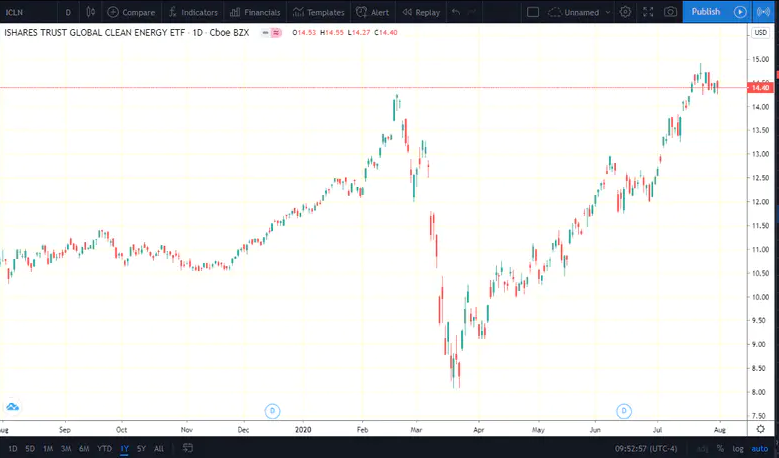
Clean Energy ETF Chart

Enter iShares Global Clean Energy ETF (NASDAQ:ICLN). ICLN is basically the world of clean energy, inclusive of solar and wind companies. For a little background on the fund, the clean energy ETF is up more than 20% this year while utility stocks have been stagnant. And let’s not even talk about what has been going on in the energy space – although energy did make dubious news recently for falling to the lowest sector weight in the S&P 500.

Back to ICLN – there are 29 stocks in the portfolio and offers investors a 1.3% yield.. not that the dividend yield matters to us CMTs

Latest comments

Risk Disclosure: Trading in financial instruments and/or cryptocurrencies involves high risks including the risk of losing some, or all, of your investment amount, and may not be suitable for all investors. Prices of cryptocurrencies are extremely volatile and may be affected by external factors such as financial, regulatory or political events. Trading on margin increases the financial risks.
Before deciding to trade in financial instrument or cryptocurrencies you should be fully informed of the risks and costs associated with trading the financial markets, carefully consider your investment objectives, level of experience, and risk appetite, and seek professional advice where needed.
Fusion Media would like to remind you that the data contained in this website is not necessarily real-time nor accurate. The data and prices on the website are not necessarily provided by any market or exchange, but may be provided by market makers, and so prices may not be accurate and may differ from the actual price at any given market, meaning prices are indicative and not appropriate for trading purposes. Fusion Media and any provider of the data contained in this website will not accept liability for any loss or damage as a result of your trading, or your reliance on the information contained within this website.
It is prohibited to use, store, reproduce, display, modify, transmit or distribute the data contained in this website without the explicit prior written permission of Fusion Media and/or the data provider. All intellectual property rights are reserved by the providers and/or the exchange providing the data contained in this website.
Fusion Media may be compensated by the advertisers that appear on the website, based on your interaction with the advertisements or advertisers.
© 2007-2024 - Fusion Media Limited. All Rights Reserved.