
Cintas Corporation (NASDAQ:CTAS) posted better-than-expected fourth-quarter fiscal 2019 (ended May 2019) results, with both earnings and revenues surpassing the Zacks Consensus Estimate.
Earnings/Revenues
Net income from continuing operations for the quarter jumped 19.5% to a record level of $226.2 million from $189.3 million in the year-ago quarter. Notably, adjusted earnings came in at $2.07 per share, up 16.9% year over year. Also, the bottom line surpassed the Zacks Consensus Estimate of $1.94.
Revenues increased 7.4% year over year to a record level of $1,793.7 million. The metric also improved 7.6% organically. Moreover, the top line surpassed the consensus estimate of $1,782 million.
Cintas Corporation Price, Consensus and EPS Surprise
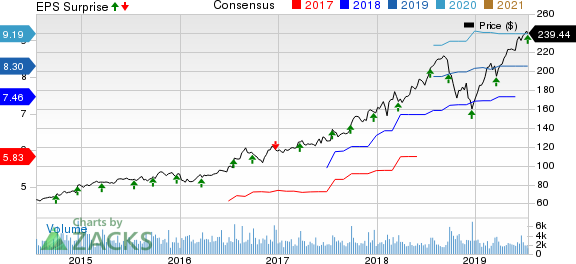
Cintas Corporation price-consensus-eps-surprise-chart | Cintas Corporation Quote
For fiscal 2019, net income and earnings per share from continuing operations were $882.6 million and $7.97, respectively, compared with $783.9 million and $7.03 last fiscal. The company reported adjusted earnings of $7.60 per share for fiscal 2019. Revenues for the year were $6,892.3 million compared with $6,476.6 million in fiscal 2018. The increase was driven by an organic growth rate of 6.5%.
Segmental Breakup
The Uniform Rental and Facility Services segment generated revenues worth $1,428.4 million in the fiscal fourth quarter, up 6.4% year over year. First Aid and Safety Services segment’s top line improved 10.7% year over year to $163.5 million. Aggregate revenues from Other businesses came in at $201.8 million, up 12.7%.
Costs/Margins
Aggregate cost and expenses for the fiscal fourth quarter was $1,479.3 million, up 5.4% year over year. Gross profit margin improved 80 basis points (bps) to 45.9%.
Selling and administrative expenses were up 7.7% year over year to $508.2 million in the reported quarter. Integration expenses related to G&K Services, Inc. (acquired in March 2017) declined 93.9% year over year to $0.9 million. Operating margin in the reported quarter was 17.5%, up 160 bps.
Balance Sheet/Cash Flow
At the end of the fiscal fourth quarter, cash and cash equivalents came in at $96.6 million compared with $138.7 million at the end of prior fiscal year. Long-term debt increased to $3,306.2 million from $3,165.8 million recorded a year ago.
For fiscal 2019, the company generated $1,067.8 million cash from operating activities, up 10.8% year over year. Capital expenditures were $276.8 million, up 1.9% year over year.
In fiscal 2019, Cintas repurchased common stock worth $1,016.3 million under its buyback program. Notably, the company paid an annual dividend of $220.8 million during fiscal 2019.
Outlook
For fiscal 2020 (ending May 2020), revenues are expected in the range of $7.24-$7.31 billion while earnings from continuing operations are expected to be between $8.30 and $8.45 per share.
Zacks Rank & Key Picks
Cintas currently carries a Zacks Rank #3 (Hold).
Some better-ranked stocks in the same space are Roper Technologies, Inc (NYSE:ROP) , DXP Enterprises, Inc (NASDAQ:DXPE) and Tetra Tech, Inc (NASDAQ:TTEK) . While Roper sports a Zacks Rank #1 (Strong Buy), DXP Enterprises and Tetra Tech carry a Zacks Rank #2 (Buy). You can see the complete list of today’s Zacks #1 Rank stocks here.
Roper exceeded estimates in each of the trailing four quarters, the average being 8.43%.
DXP Enterprises surpassed estimates thrice in the trailing four quarters, the average being 48.47%.
Tetra Tech surpassed estimates in each of the trailing four quarters, the average being 8.22%.
Today's Best Stocks from Zacks
Would you like to see the updated picks from our best market-beating strategies? From 2017 through 2018, while the S&P 500 gained +15.8%, five of our screens returned +38.0%, +61.3%, +61.6%, +68.1%, and +98.3%.
This outperformance has not just been a recent phenomenon. From 2000 – 2018, while the S&P averaged +4.8% per year, our top strategies averaged up to +56.2% per year.
See their latest picks free >>
Roper Technologies, Inc. (ROP): Free Stock Analysis Report
Cintas Corporation (CTAS): Free Stock Analysis Report
DXP Enterprises, Inc. (DXPE): Free Stock Analysis Report
Tetra Tech, Inc. (TTEK): Free Stock Analysis Report
Original post
Zacks Investment Research