
Cimarex Energy Co. (NYSE:XEC) reported third-quarter 2019 earnings per share of 91 cents, missing the Zacks Consensus Estimate of 93 cents and declining from the year-ago quarter’s $1.99.
Total revenues of $582.3 million beat the Zacks Consensus Estimate of $570 million but declined from the year-ago quarter’s $591.5 million.
The weak earnings can be attributed to lower commodity price realizations, partially offset by increased production volumes.
Cimarex Energy Co Price, Consensus and EPS Surprise
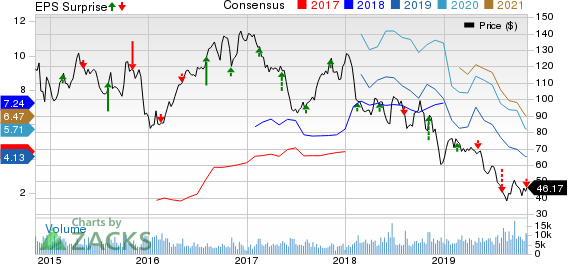
Cimarex Energy Co price-consensus-eps-surprise-chart | Cimarex Energy Co Quote
Operational Highlights
Production Rises
In the quarter under review, total production averaged 287.1 thousand barrels of oil equivalent per day (MBOED), up from 218.6 MBOED in the year-ago period on considerably higher activities in the Permian Basin. Output from the basin surged 64% year over year to 198.6 MBOED.
Through the September quarter, this upstream energy player brought 96 gross wells online.
Total oil volumes rose to 89.7 thousand barrels per day (MBbls/d) from 63.9 MBbls/d in the year-ago period. Moreover, natural gas production increased to 718 MMcf/d from the year-ago level of 558.8 MMcf/d. Natural gas liquids (NGL) volumes jumped to 77.7 MBbls/d from the year-ago figure of 61.6 MBbls/d.
Production expense in the quarter was recorded at $3.34 per BOE, down 12% from the year-ago figure.
Realized Prices Decline
Realized prices for natural gas plunged 52% to 88 cents per thousand cubic feet, and the same for crude oil and NGL fell 10% and 58% year over year to $52.71 and $10.80 per barrel, respectively.
Financial Condition
As of Sep 30, 2019, the company had cash and cash equivalents of $23.9 million. Net long-term debt was almost $2 billion, which represents a debt-to-capitalization ratio of almost 33.8%.
Cimarex's adjusted cash flow from operating activities totaled $360.7 million, down from $388.7 million in the prior-year quarter. The company spent almost $296 million on exploration and development in the September quarter, of which 84% was directed toward the Permian Basin.
Guidance
Cimarex projects total production for the December quarter of 2019 in the range of 272-292 MBOED. The company also issued its projections of oil equivalent productions for 2019 in the band of 274-278 MBOED.
For 2019, the company lowered its guidance for capital spending on exploration & development activities by 4% to the range of $1.3-$1.4 billion. Cimarex is expected to invest $70 million in midstream operations in 2019. Production expense per BOE is expected in the range of $3.30-$3.55 for 2019.
Assuming WTI crude price at $50 per barrel and NYMEX gas price at $2.50, the company expects Permian operations to generate strong free cash flows.
Zacks Rank and Stocks to Consider
Currently, Cimarex has a Zacks Rank #5 (Strong Sell). Some better-ranked players in the energy space are Lonestar Resources US Inc. (NASDAQ:LONE) , CNX Resources Corporation (NYSE:CNX) and Contango Oil & Gas Company (NYSE:MCF) . All these companies carry a Zacks Rank #2 (Buy). You can see the complete list of today’s Zacks #1 Rank (Strong Buy) stocks here.
Lonestar’s 2020 earnings per share are expected to rise 77% year over year.
CNX Resources’ 2019 earnings per share have witnessed two upward movements and no downward revision in the past 30 days.
Contango Oil & Gas’ bottom line for the current year is expected to rise around 87% year over year.
Just Released: Zacks’ 7 Best Stocks for Today
Experts extracted 7 stocks from the list of 220 Zacks Rank #1 Strong Buys that has beaten the market more than 2X over with a stunning average gain of +24.5% per year.
These 7 were selected because of their superior potential for immediate breakout.
See these time-sensitive tickers now >>
CNX Resources Corporation. (CNX): Free Stock Analysis Report
Cimarex Energy Co (XEC): Free Stock Analysis Report
Lonestar Resources US Inc. (LONE): Free Stock Analysis Report
Contango Oil & Gas Company (MCF): Free Stock Analysis Report
Original post
Zacks Investment Research