
Ciena Corporation (NYSE:CIEN) reported mixed financial results for the second-quarter fiscal 2018 (ended Apr 30, 2018).
Net Income
On a GAAP basis, net income for the reported quarter came in at $13.9 million or 9 cents per share compared with $38 million or 25 cents per share in the year-ago quarter. The year-over-year decrease was primarily due to higher cost of goods sold.
Non-GAAP net income was $33.8 million or 23 cents per share compared with $48.2 million or 30 cents per share in the year-ago quarter. The bottom line missed the Zacks Consensus Estimate by 7 cents.
Revenues
Quarterly total revenues increased 3.3% year over year to $730 million, driven by continued growth in APAC (Asia Pacific) service providers as well as global webscale customers. Notably, India alone delivered $79 million in quarterly revenues, up 20% year over year.
The top line surpassed the Zacks Consensus Estimate of $729 million.
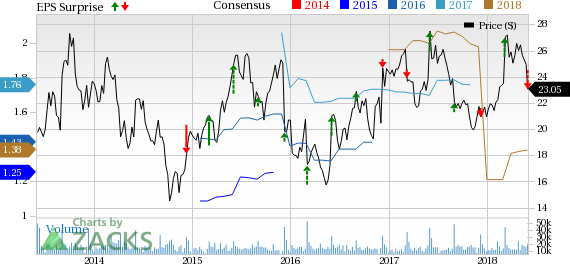
Ciena Corporation Price, Consensus and EPS Surprise
Operating Metrics
Gross margin was 40.2% compared with 45% in the year-ago quarter, impacted by several new, international service provider deployments.
Operating expenses were $261.2 million compared with $260.4 million in the year-earlier quarter. Operating margin was 4.4% compared with 8.2% in the prior-year quarter.
Adjusted EBITDA was $77.1 million, down from $107.6 million in the year-earlier quarter owing to higher cost of goods sold and operating expenses.
Segmental Performance
Revenues from Networking Platforms increased 3.5% year over year to $591.7 million. Software and Software-Related Services revenues were $38.7 million compared with $37.7 million in the prior-year quarter. Revenues from Global Services were $99.6 million compared with $97.8 million in the year-earlier quarter.
Acquisition
During the quarter, Ciena inked a definitive agreement to acquire Packet Design, LLC, a provider of network performance management software focused on Layer 3 network optimization, topology and route analytics, for an undisclosed amount.
The buyout is expected to accelerate Ciena’s software strategy and contribute toward its long-term financial goal of growing its Blue Planet and associated services business by approximately 14-16% annually over the next three years.
Share Repurchases
During the quarter, Ciena repurchased approximately 1.4 million shares of common stock for an aggregate amount of $33.4 million.
Cash Flow
During the quarter, Ciena generated $37.4 million as cash from operating activities while its free cash flow amounted to $31.1 million. Cash flow for the first six months of 2018 improved to $73.1 million from $45.7 million in the prior-year period.
Liquidity
As of Apr 30, 2018, Ciena had $652.1 million of cash and cash equivalents and $585.5 million of net long-term debt.
The company ended the quarter with approximately $980 million in cash and investments.
Zacks Rank & Stocks to Consider
Ciena currently carries a Zacks Rank #3 (Hold). A few better-ranked stocks in the broader industry are Motorola Solutions, Inc. (NYSE:MSI) , BlackBerry Limited (NYSE:BB) and Ubiquiti Networks, Inc. (NASDAQ:UBNT) . While Motorola and BlackBerry sport a Zacks Rank #1 (Strong Buy), Ubiquiti carries a Zacks Rank #2 (Buy). You can see the complete list of today’s Zacks #1 Rank stocks here.
Motorola has an expected long-term earnings growth rate of 8%. It beat earnings estimates in each of the trailing four quarters, the average being 12.1%.
BlackBerry has an expected long-term earnings growth rate of 18.6%. It has beaten earnings estimates twice in the trailing four quarters, the average being a positive 500%.
Ubiquiti has an expected long-term earnings growth rate of 18.6%. It surpassed earnings estimates thrice in the trailing four quarters, the average being a positive 8.9%.
More Stock News: This Is Bigger than the iPhone!
It could become the mother of all technological revolutions. Apple (NASDAQ:AAPL) sold a mere 1 billion iPhones in 10 years but a new breakthrough is expected to generate more than 27 billion devices in just 3 years, creating a $1.7 trillion market.
Zacks has just released a Special Report that spotlights this fast-emerging phenomenon and 6 tickers for taking advantage of it. If you don't buy now, you may kick yourself in 2020.
Click here for the 6 trades >>
Motorola Solutions, Inc. (MSI): Free Stock Analysis Report
Ubiquiti Networks, Inc. (UBNT): Free Stock Analysis Report
Ciena Corporation (CIEN): Free Stock Analysis Report
BlackBerry Limited (BB): Free Stock Analysis Report
Original post