
Chubb Limited (NYSE:CB) reported second-quarter 2016 operating income of $2.25 per share, which missed the Zacks Consensus Estimate of $2.26 by 0.4%. Also, the bottom line deteriorated 6.3% from $2.40 per share in the prior-year quarter.
After adjusting for one-time items, net income came in at $1.54 per share, down 46.2% year over year.
Net premiums written surged 59.7% year over year to about $7.6 billion in the reported quarter. Net premiums earned increased 69.8% year over year to $7.4 billion.
Net investment income was $708 million, up 25.9% year over year.
Property and casualty (P&C) underwriting income totaled $609 million, up 27.4% year over year. However, combined ratio deteriorated 350 basis points (bps) year over year to 91.2%.
Segment Update
North America Commercial P&C Insurance: Net premiums written soared 127.2% year over year to $3.2 billion. Combined ratio deteriorated 490 bps year over year to 89.5%.
North America Personal P&C Insurance: Net premiums written surged 125.1% year over year to $1.2 billion. Combined ratio deteriorated 1950 bps year over year to 90.1%.
Overseas General Insurance: Net premiums written rose 21.7% year over year to $2.0 billion. Combined ratio deteriorated 170 bps year over year to 90.9%.
North America Agricultural Insurance: Net premiums written dipped 1.1% year over year to $375 million. Combined ratio deteriorated 230 bps year over year to 95.9%.
Global Reinsurance: Net premiums written decreased 11.9% year over year to $230 million. Combined ratio deteriorated 1410 bps year over year to 79.8%.
Life Insurance: Net premiums written increased 5.4% year over year to $527 million. International life insurance net premiums and deposits collected improved 15.3% year over year in constant dollars.
Financial Update
Cash balance was $1.0 billion as of Jun 30, 2016, down 43% from $1.8 billion at the end of 2015. Total shareholders' equity soared 62.1% from $29.2 billion at year-end 2015 to $47.2 billion.
Book value per share was $101.56 as of Jun 30, 2016, up 13.1% from year-end 2015.
Operating cash flow came in at $1.1 billion.
CHUBB LTD Price, Consensus and EPS Surprise
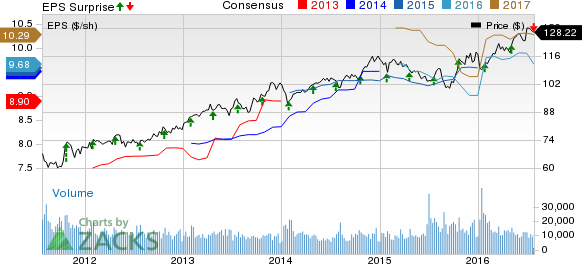
CHUBB LTD Price, Consensus and EPS Surprise | CHUBB LTD Quote
Zacks Rank and Performance of Other P&C Insurers
Chubb currently carries a Zacks Rank #3 (Hold). Among other property and casualty (P&C) insurers that have reported their second-quarter earnings so far, the bottom line at RLI Corp. (NYSE:RLI) and Progressive Corp. (NYSE:PGR) missed their respective Zacks Consensus Estimates, while First American Financial Corporation’s earnings (NYSE:FAF) beat the same.
Want the latest recommendations from Zacks Investment Research? Today, you can download 7 Best Stocks for the Next 30 Days.Click to get this free report >>
RLI CORP (RLI): Free Stock Analysis Report
CHUBB LTD (CB): Free Stock Analysis Report
PROGRESSIVE COR (PGR): Free Stock Analysis Report
FIRST AMER FINL (FAF): Free Stock Analysis Report
Original post
Zacks Investment Research