
With negative sentiment toward China reaching an extreme in recent months, patient investors have been rewarded with recent news of improving data from the Asian giant.
CLSA Sinology’s Andy Rothman reported that in September, retail-sales growth rose 13.2%, which was the fastest pace of the year. Real urban disposable income grew nearly 10% and real rural disposable income rose more than 12% during the first three quarters of the year. And, while export numbers are weak, China has “so far avoided the large-scale export-sector layoffs that led to 2009’s massive stimulus,” says Andy.
There was strength in commodity imports, too. Copper imports into China increased 11% compared to the previous month due to increased demand from power infrastructure, white goods restocking and auto production. Iron ore rose a modest 4% compared to the previous month, which is encouraging. There was also a sharp rebound in oil imports most likely due to holiday restocking and lower international prices. In fact, Pareto Securities found that Chinese implied oil demand came in at an all-time high of 9.8 million barrels per day in September.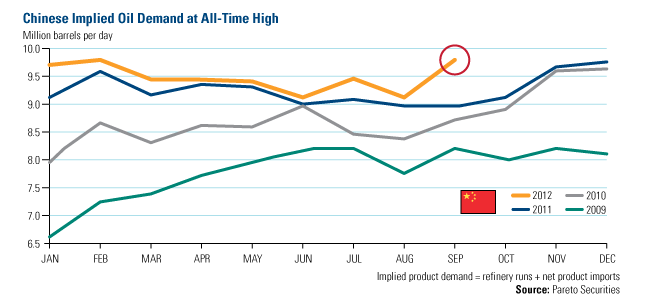
Spending Growth
The markets also saw an increase in fixed asset investment (FAI), a measure of capital spending, which grew at “the fastest pace since October 2011,” says CLSA. According to Credit Suisse, “a surge in transportation spending in the month of September [is] starting to reflect the project approvals for highway, rail, airport, and metropolitan transport projects announced in May and June.”
While Credit Suisse says FAI growth was boosted by government investment stimulus, CLSA also notes that fixed asset investment and capital spending by private firms has been rising faster than state-owned firms for 30 of the last 31 months.
Key Economic 'Lubricant'
Money supply, a key lubricant of the economy and markets, also continued to increase, and this has historically driven Chinese equities. Take a look at the chart below, which shows the year-over-year money supply compared to the MSCI China Index over the past decade. Over the past 10 years, after the supply in money bottomed, stocks soon rebounded.
On January 31, 2012, money supply hit a near decade low of 12.4% year-over-year growth. Since then, the number has been creeping higher, rising sharply to 14.8% in September, and shortly thereafter, equities responded.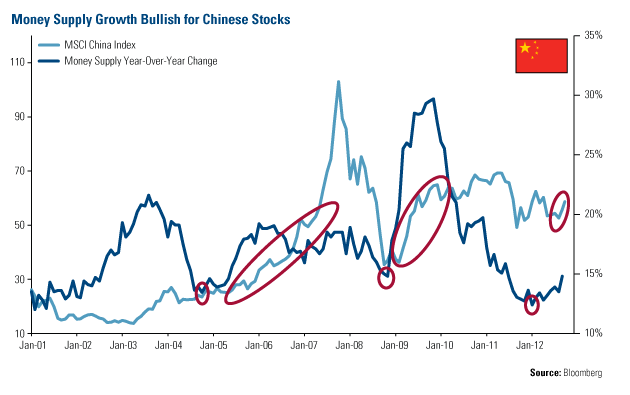
The Wall Street Journal recognized the improvement in Asian stocks and investor sentiment recently, suggesting that the “region’s economy could be nearing the end of a slowdown.” I’ve been trying to temper investors’ expectations of China as weak economic data caused investors to be skittish, telling Investor Alert readers that it wasn’t the time to be bearish. Now, “if the Chinese economy shows sustained signs of stabilizing, it would remove a major overhang of worry for investors in Asia, and may spur more capital raising and other deals as investors become confident enough to switch money out of bonds and back into equity markets,” says The Journal.
Historic Lows
This appears to be a good time to be investing in China, as stocks are historically cheap. At the beginning of October, BCA noted that there was a “prevailing pessimism” around China and that the stocks were “currently trading at hefty discounts to world averages and even to euro zone stocks.” The firm indicated that Chinese shares had a forward price-to-earnings ratio of below 9 times; the world and U.S. benchmarks traded at 12 and 13 times, respectively.
Chinese stocks are also cheap compared to emerging markets. In 2007, China traded at a 75% premium to emerging markets. Today, Chinese stocks trade at a 20% discount. If you look at a comparison of price-to-earnings in China to those in emerging markets, you have to go back to 2006 to find that ratio as low as it is today.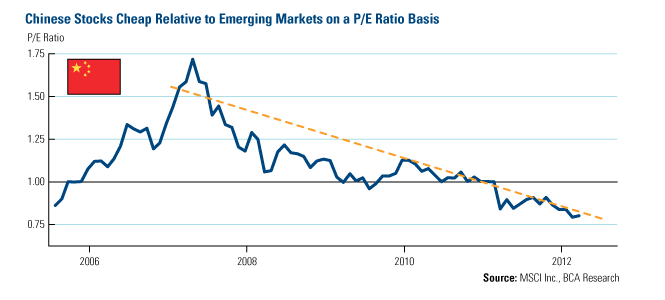
The low price-to-earnings indicates to me that the negativity pendulum has swung too far. “Investors have turned from euphoria at the height of the ‘China mania’ five years ago to extreme pessimism,” says BCA.
Back in April, I listed three trends that global investors should watch in China: A rebound in the liquidity cycle signaling a rally in equity prices, a new leadership with an incentive to maintain growth, and Chinese stocks reverting to their mean, as history appears to favor Chinese stocks landing in the top half of emerging markets. Time will tell.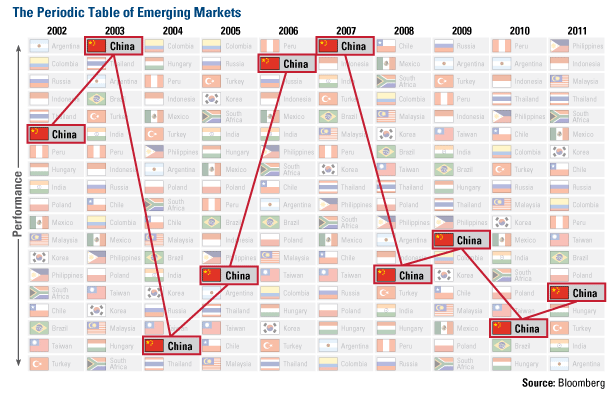
U.S. Global Investors, Inc. is an investment management firm specializing in gold, natural resources, emerging markets and global infrastructure opportunities around the world. The company, headquartered in San Antonio, Texas, manages 13 no-load mutual funds in the U.S. Global Investors fund family, as well as funds for international clients.
The MSCI China Index is a capitalization weighted index that monitors the performance of stocks from the country of China. M2 Money Supply is a broad measure of money supply that includes M1 in addition to all time-related deposits, savings deposits, and non-institutional money-market funds.
- English (UK)
- English (India)
- English (Canada)
- English (Australia)
- English (South Africa)
- English (Philippines)
- English (Nigeria)
- Deutsch
- Español (España)
- Español (México)
- Français
- Italiano
- Nederlands
- Português (Portugal)
- Polski
- Português (Brasil)
- Русский
- Türkçe
- العربية
- Ελληνικά
- Svenska
- Suomi
- עברית
- 日本語
- 한국어
- 简体中文
- 繁體中文
- Bahasa Indonesia
- Bahasa Melayu
- ไทย
- Tiếng Việt
- हिंदी
Chinese Stocks Look Like A Bargain
Published 10/22/2012, 04:08 PM
Updated 07/09/2023, 06:31 AM
Chinese Stocks Look Like A Bargain
Latest comments
Loading next article…
Install Our App
Risk Disclosure: Trading in financial instruments and/or cryptocurrencies involves high risks including the risk of losing some, or all, of your investment amount, and may not be suitable for all investors. Prices of cryptocurrencies are extremely volatile and may be affected by external factors such as financial, regulatory or political events. Trading on margin increases the financial risks.
Before deciding to trade in financial instrument or cryptocurrencies you should be fully informed of the risks and costs associated with trading the financial markets, carefully consider your investment objectives, level of experience, and risk appetite, and seek professional advice where needed.
Fusion Media would like to remind you that the data contained in this website is not necessarily real-time nor accurate. The data and prices on the website are not necessarily provided by any market or exchange, but may be provided by market makers, and so prices may not be accurate and may differ from the actual price at any given market, meaning prices are indicative and not appropriate for trading purposes. Fusion Media and any provider of the data contained in this website will not accept liability for any loss or damage as a result of your trading, or your reliance on the information contained within this website.
It is prohibited to use, store, reproduce, display, modify, transmit or distribute the data contained in this website without the explicit prior written permission of Fusion Media and/or the data provider. All intellectual property rights are reserved by the providers and/or the exchange providing the data contained in this website.
Fusion Media may be compensated by the advertisers that appear on the website, based on your interaction with the advertisements or advertisers.
© 2007-2024 - Fusion Media Limited. All Rights Reserved.