
According to the Chicago Fed National Activity Index, June economic activity increased from May. The three-month moving average of the indicator, while still negative (meaning below-trend growth), has reversed a three-month decline.
The Chicago Fed's National Activity Index (CFNAI) is a monthly indicator designed to gauge overall economic activity and related inflationary pressure. It is a composite of 85 monthly indicators as explained in this background PDF file on the Chicago Fed's website. The index is constructed so a zero value for the index indicates that the national economy is expanding at its historical trend rate of growth. Negative values indicate below-average growth, and positive values indicate above-average growth.
The first chart below is based on the complete CFNAI historical series dating from March 1967. The red dots show the indicator itself, which is quite noisy, and the three-month moving average (CFNAI-MA3), which is more useful as an indicator of coincident economic activity. I've also highlighted official recessions.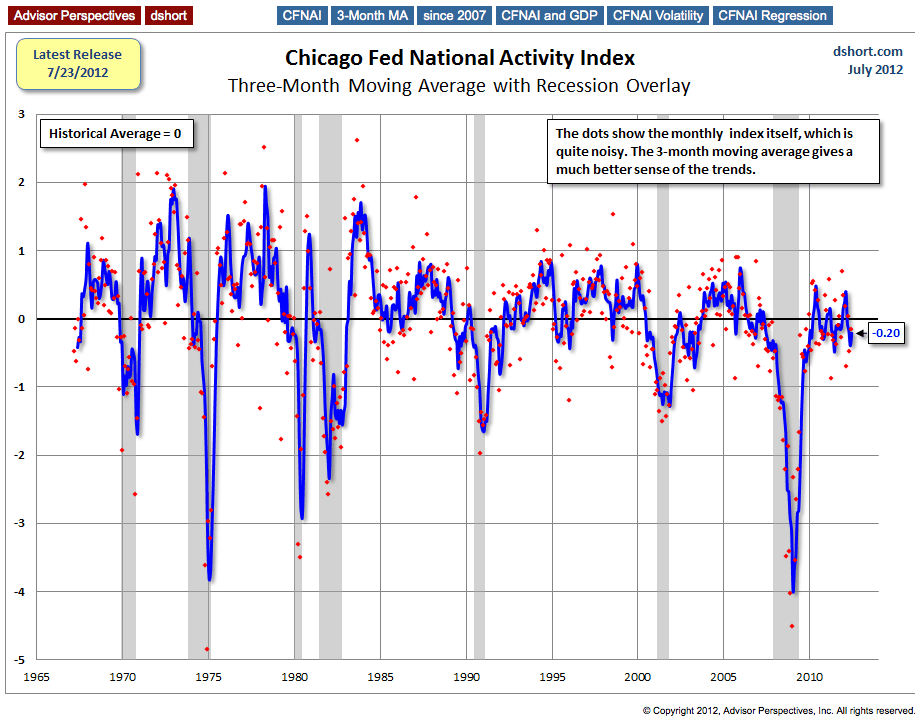
For a clearer look at the recent behavior of the index, here is a closeup view since 2007.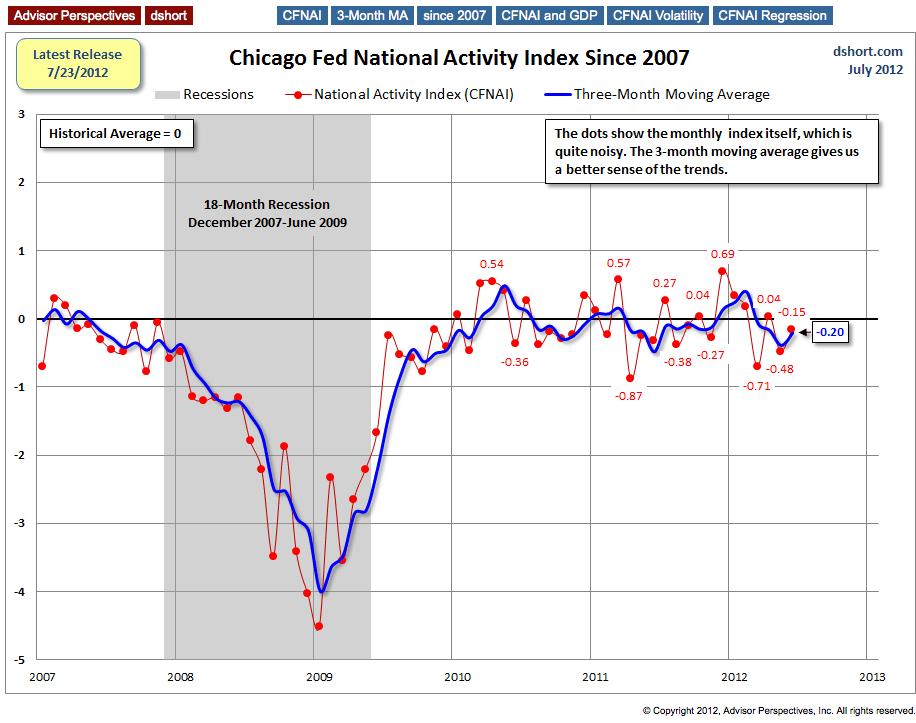
The next chart highlights the -0.7 level. The Chicago Fed explains:
- When the CFNAI-MA3 value moves below -0.70 following a period of economic expansion, there is an increasing likelihood that a recession has begun. Conversely, when the CFNAI-MA3 value moves above -0.70 following a period of economic contraction, there is an increasing likelihood that a recession has ended.
With the exception of the 1973-75 recession, the -0.7 level has coincided fairly closely with recession boundaries. The 1973-75 event was perhaps an outlier because of the rapid rise of inflation following the 1973 Oil Embargo. Otherwise a cross below the -0.7 level has synchronized within a month or two of a recession start. A cross above the level has lagged recession ends by 2-4 months.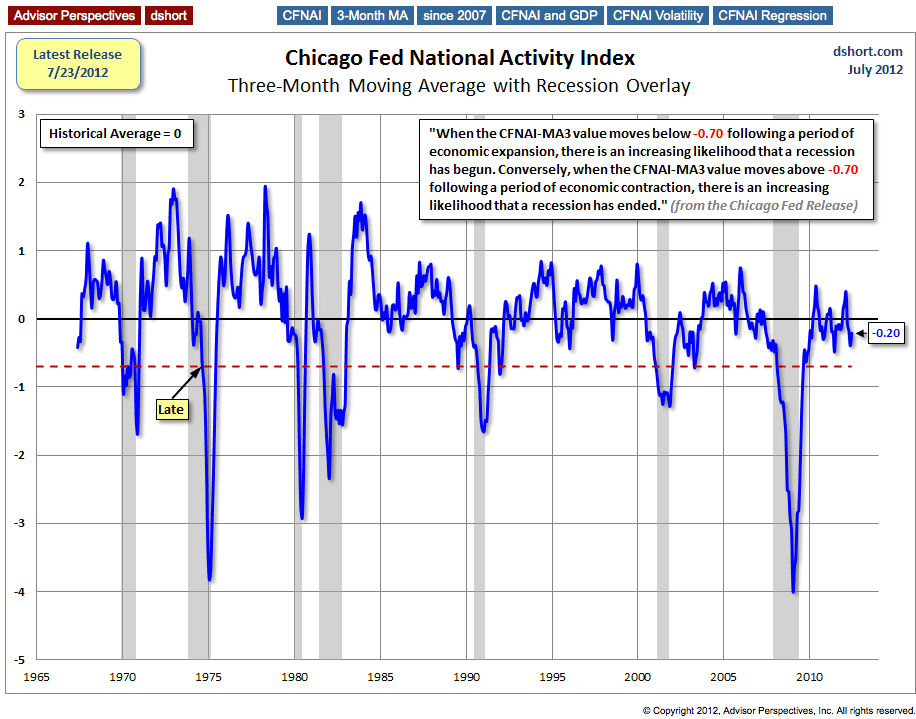
The next chart includes an overlay of GDP, which reinforces the accuracy of the CFNAI as an indicator of coincident economic activity.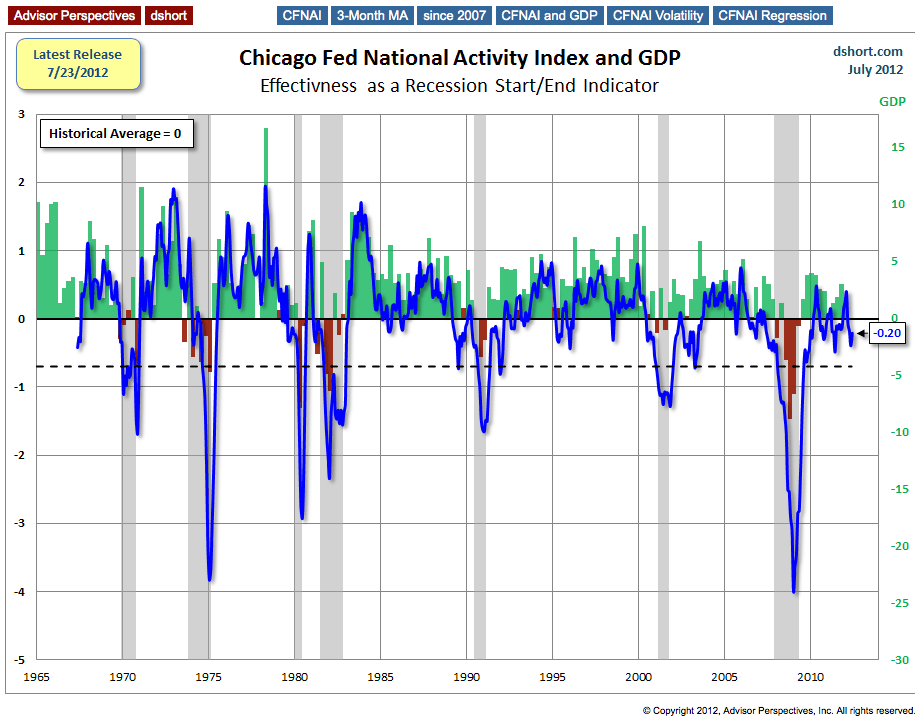
Here's a chart of the CFNAI without the MA3 overlay -- for the purpose of highlighting the high inter-month volatility. Consider: the index has ranged from a high 2.61 to a low of -4.85 with a average monthly change of 0.60. That's 8% of the entire index range! The latest reading is a month-over-month change of 0.33, which is relatively insignificant.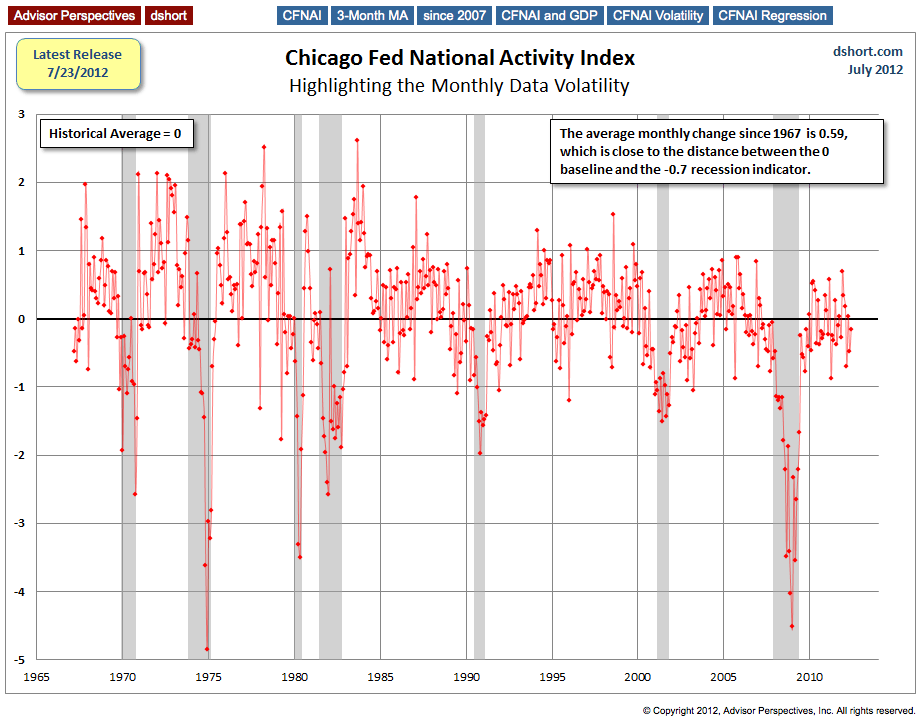
Further underscoring the volatility is the roller-coaster list of CFNAI monthly headlines from 2010 forward.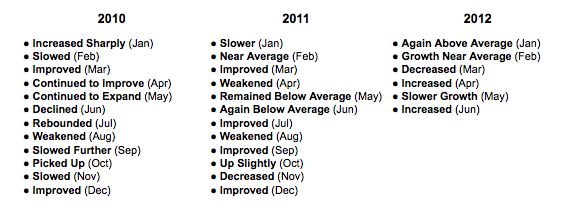
As the monthly chart depicts and the headline verbs reinforce, it's unwise to read very much into the data for any specific month. The three-month moving average is the number to watch.
The Long-Term Economic Trend
In the final chart I've let Excel draw a linear regression through the CFNAI data series. The slope confirms the casual impression of the previous charts that National Activity, as a function of the 85 indicators in the index, has been declining since its inception in the late 1960s, a trend that roughly coincides with the transition from a good-producing to a post-industrial service economy in the information age.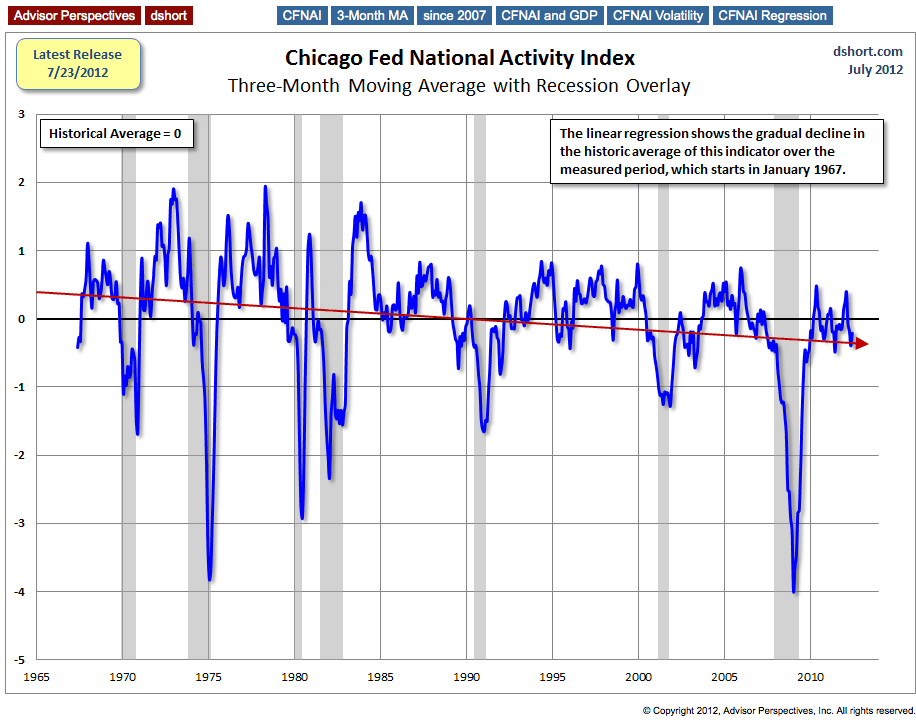
For a more detailed perspective on long-term economic trends, see my latest Understanding the CFNAI Components, which I update and post around 11 AM EST after the CFNAI is released.