
There has been a litany of articles written recently discussing how the stock market is set for a continued bull rally and that last year’s 20% decline was just an anomaly. The are some primary points that are common threads among each of these articles which are: 1) interest rates are low, 2) corporate profitability is high, and; 3) the Fed continues to put a floor under stocks, and 4) there is no recession in sight. Each of these arguments, while currently accurate, are based primarily on artificial influences and conjecture.
- Interest rates are low because real economic growth remains weak.
- Profitability is high due to accounting gimmicks and share repurchases.
- The Fed is verbally putting a floor under stocks but continues to extract liquidity from the market, and;
- “There is no recession in sight” argument have been famous last words historically.
While the promise of a continued bull market is very enticing it is important to remember that all markets ultimately complete a “full cycle.” Therefore, if your portfolio, and ultimately your retirement, is dependent upon the thesis of an indefinite bull market, you should at least consider the following charts.
It is often stated that valuations are still cheap based on forward estimates. However, forward estimates are always flawed, overly estimated, and repeatedly lead to poor outcomes over time (buy high/sell low) Therefore, trailing reported earnings is truly the only measure one should use.
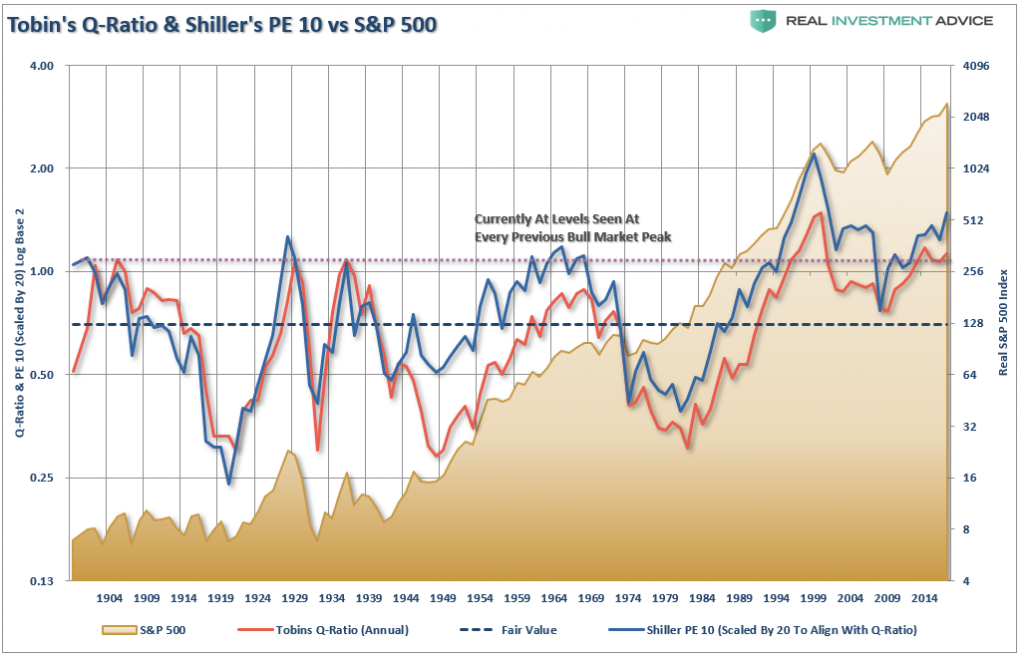
The chart below shows Dr. Robert Shiller’s cyclically adjusted P/E ratio combined with Tobin’s Q-Ratio. Both measures of valuations simply show that markets are not cheap, which historically lead to lower future returns.
- Shiller’s PE Ratio – is calculated by taking the current price of the market and dividing it by the average of 10-years of reported earnings.
- Tobin’s Q Ratio – is calculated as the market value of a company divided by the replacement value of the firm’s assets.)
Most people dismiss valuations because of their inefficiency in dictating market turns. I understand.
However, valuations are NOT, and have never been, a market timing indicator. They are simply a “road map” to future returns.
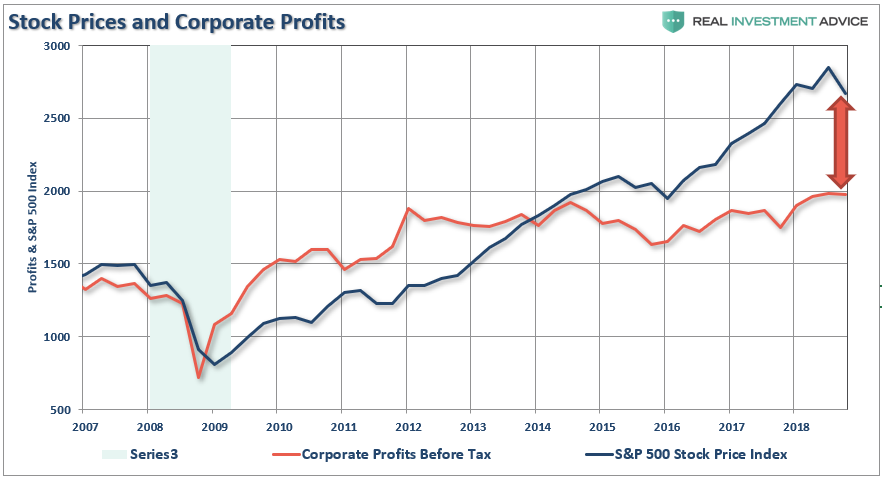
On a much shorter time-frame, a look at the price of the market as compared to corporate profits gives us a better clue. Currently, with the market trading substantially above the level of corporate profits, any weakness in profit growth (which is heavily tied to economic growth) will foster a reversion in price.
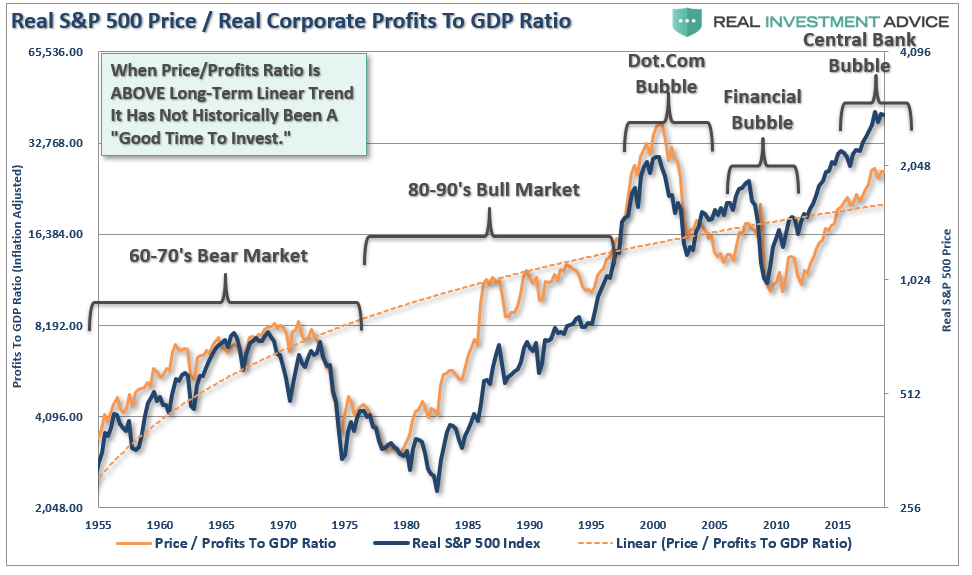
Another way to look at the excess over time is by examining the inflation-adjusted S&P 500 index as compared to real profits. Note that previous extensions of price above profits have generally not ended well when profit growth reversed.
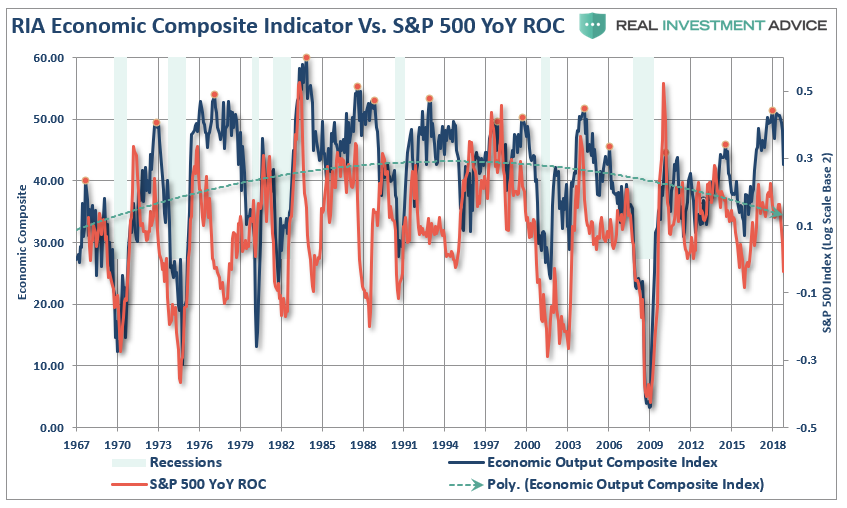
We recently proved this point by looking at the RIA Economic Composite Index as compared to the annual rate of change of the market. Not surprisingly, markets tend to perform poorly during weakening economic environments.
Another way to look at the issue of profits as it relates to the market is shown below. When we measure the cumulative change in the S&P 500 index as compared to the level of profits we find again that when investors pay more than $1 for a $1 worth of profits there is an eventual mean reversion.
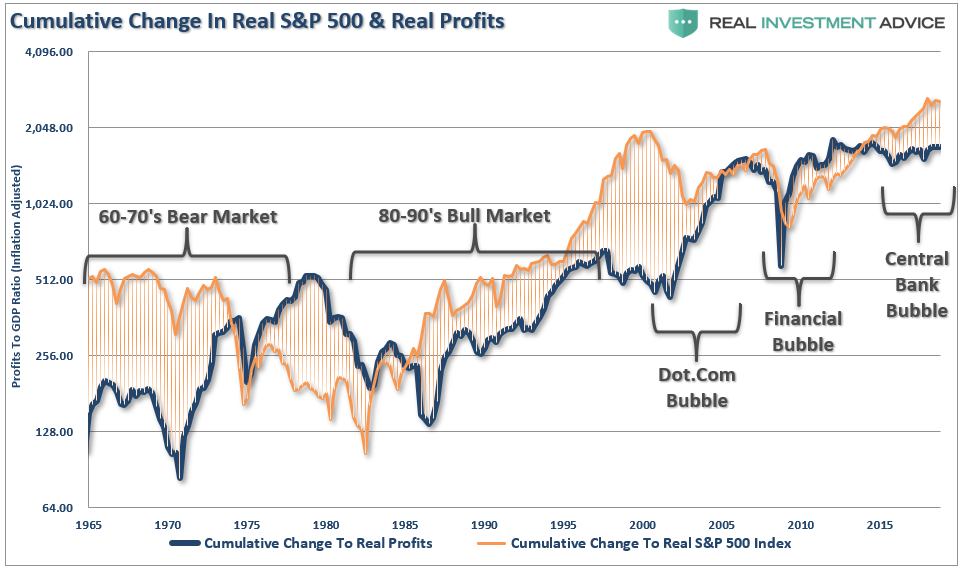
The correlation is clearer when looking at the market versus the ratio of corporate profits to GDP. (Again, since corporate profits are ultimately a function of economic growth, the correlation is not unexpected.) With investors paying more today than at any point in history, the next mean reversion will be a humbling event.
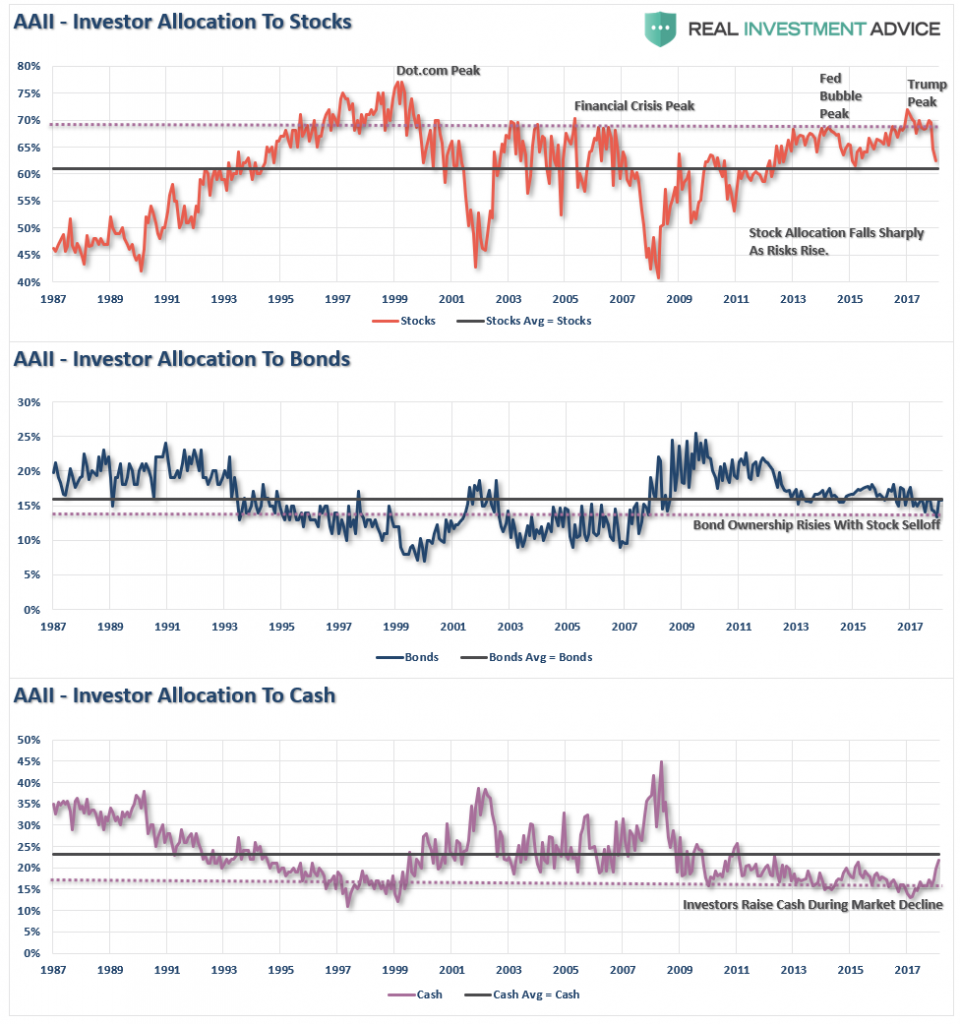
Another argument made lately to support the bullish meme is that retail investors have all jumped out of the market. The chart below shows the percentage of stocks, bonds and cash owned by individual investors according to the American Association of Individual Investor’s survey. As you can see, equity ownership did indeed drop from the second highest level on record. However, while many are suggesting this is “bullish,” it is worth noting that historically sharp downturns have also denoted the start of bigger declines and bear markets.
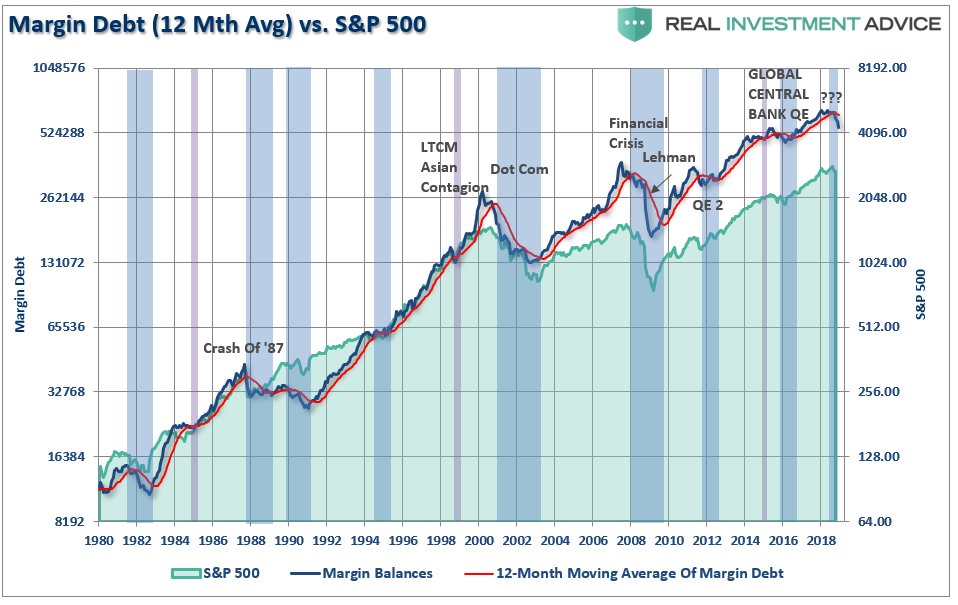
As we have noted previously, investors have been leveraging up portfolios to chase the market. The issue with margin debt is NOT the increasing levels of it. Rising leverage provides buying power to continue to push stocks higher. The issue of margin debt is when it reverses. Just as margin debt increases the rise of stock prices, the reverse is also true.
The chart below shows the history of margin debt levels versus the 12-month moving average. Over the last decade, when the 12-month moving average was violated it has previously been met with Central Bank interventions. Currently, the Fed still remains on a path of reducing accommodative policy and liquidity is being slowly drained. The decline in margin debt is an additional removal of liquidity which has previously supported higher asset prices.
As a money manager, we are currently long the stock market albeit at reduced levels currently. The reality is that I must maintain exposure or potentially suffer career risk. However, my job is not only to make money for my clients, but also to preserve their gains, and investment capital, as much as possible.
The bullish case is based on expectations that current trends from the last decade will continue indefinitely, such as:
- Profit margins will only grow and never mean revert.
- Yields will remain stable at low levels.
- Fed rate hikes and yield curve inversions no longer matter
- Weakness in housing, autos, and other credit sensitive areas will not impact domestic growth.
- $1 Trillion+ deficits won’t slow the economy.
- Inflationary pressures will remain forever muted.
- Political turmoil will not roil markets or inhibit consumer confidence.
- U.S. dollar won’t appreciate to higher levels
- The U.S. economy can remain indefinitely decoupled from the rest of world.
- Trade wars and tariffs are a non-event.
- Corporations will continue to be the predominant purchasers of U.S. stocks.
- Liquidity will remain plentiful.
- The Central Bank “put” will remain in place forever.
- This time is different.
Understanding these bullish arguments is important. But more importantly is the understanding that many of these beliefs have already begun to deteriorate and are substantially increasing the risk to investors and their capital. The markets will not rise indefinitely, and the eventual mean reversion will be more destructive than most realize.
Unfortunately, since most individuals only consider the “bull case,” as it creates confirmation bias for their “greed” emotion, they never see the “train coming.”
Hopefully, these charts will give you some food for thought.