Last week the question was whether hitting the February gap had any relevance. Other than a bit of back and forth, it did not and the market continued higher according to the program that is currently in place. But a slight squeeze above the February gap alone is not enough to declare it all irrelevant. For now, of course, markets are still ignoring valuations and fundamentals as the liquidity machine retains control, but the search for relevance is far from over.
Indeed perhaps something potentially more relevant crossed the radar yesterday.
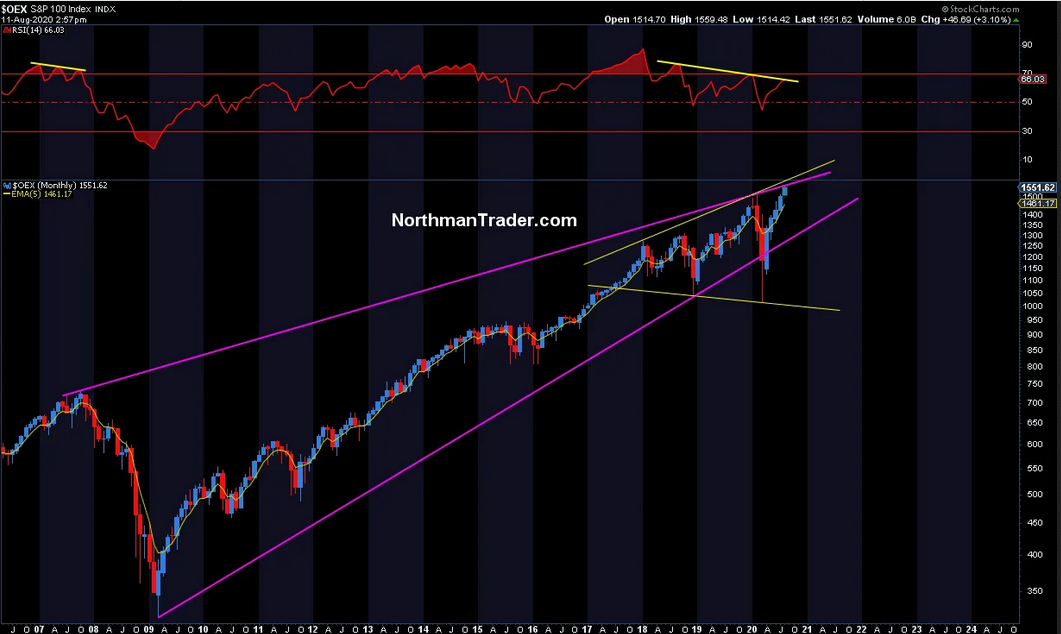
Specifically, one chart has caught my attention, it is a monthly chart hence I call this the chart of the month for the monthly close and the action into September/October may tell us a lot more about the sustainability of this program rally to new highs.
It is one of the most important but least quoted charts out there, the OEX or S&P 100, it contains the biggest stocks out there including the big cap tech stocks such as $AAPL. $AMZN, $GOOGL, $MSFT. And it is the incredible tech rally of 2020 that has propelled $OEX to new all time highs in August.
But this is where it gets interesting. The chart has been building relevant trend lines for a number of years:

Several things to note:
One, the February 2020 highs established a new trend line with the 2007 highs. This trend line was hit yesterday.
Two, the support trend line was formed from the 2009 lows with the December 2018 lows and held on a monthly close during the crash months of February and March. And note, since the March lows, OEX has rallied in steady fashion 5 months straight back to the top of the trend line and hit it yesterday.
Three, all new highs since 2018 have come on negative monthly RSI divergences and each new high has resulted in a sizable negative reaction. This week’s highs also came on negative divergence.
Fourth, the peaks and valleys of these recent highs and lows (since 2017) have formed a broadening wedge. That wedge has room higher if the current trend line does not hold as resistance. Both of these trend lines suggest that OEX is facing sizable resistance here without at least a sizable pullback first.
Fifth, OEX, like many charts, is far extended above its monthly 5EMA (exponential moving average). While 5 EMA extensions have occurred in the past the most common quality of market functioning is to reconnect with the monthly 5 EMA at some stage as the history of the chart amply demonstrates.
Given resistance above and the 5 EMA relationship below rallies are likely to run into selling pressure between the 2007 trend line here or the trend line slightly higher up.
A monthly 5 EMA reconnect may offer a long entry opportunity, but beware, a confirmed drop below it may suggest a much more severe corrective move in the offing which would then risk a revisit of the lower pattern trend lines suggesting massive correction risk. But that hasn’t happened yet. The relationship may prove critical to watch into September and October, hence OEX is my chart of the month to watch.
