by Pinchas Cohen
Yesterday, during what started out as a risk-on day for markets after news of the Qatari rift with a coalition of its Middle Eastern neighbors broke, safe haven assets became good, equities bad, and oil turned ugly.
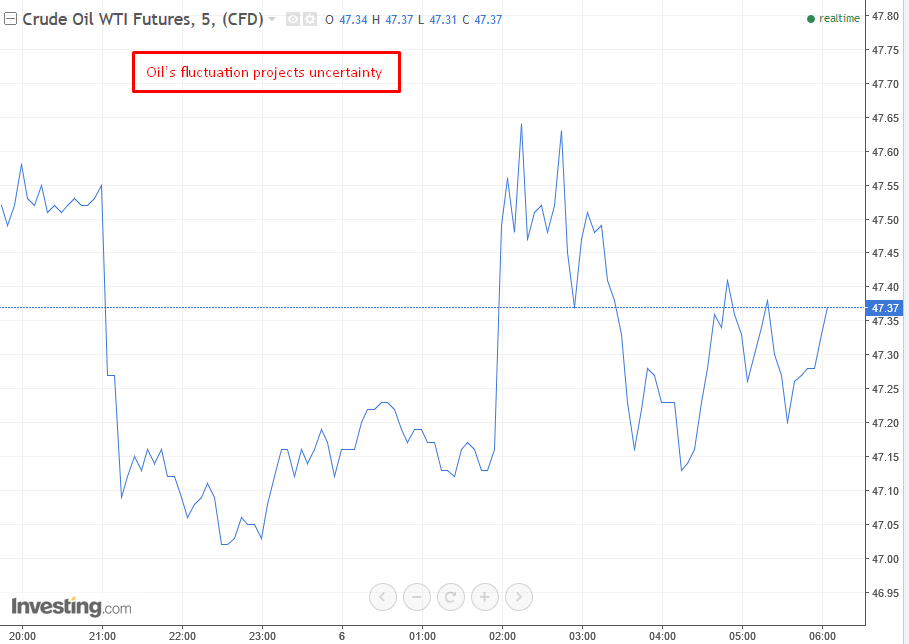
From yesterday’s close of $47.40 in the US, it advanced in global markets by 0.4% to a high of $47.58, at 20:00 EDT last night. Then, within just two minutes, between 21:05 and 21:07 EDT, it plunged 0.7% to a low of $47.23. Between 21:07 and 21:12 it regrouped, amidst a flurry of contracts changing hands between buyers and seller.
Then it flattened for a 5-minute stint, in which all it could regain was 0.17% but the commodity was overwhelmed by shorts and plunged within a single minute, at 21:16, by 0.38% . It bottomed at 22:24 with a low of $46.94, after which it took two hours and 11 minutes to pare 0.7% of the day’s nearly full percent loss—this by 00:35 EDT.
At that point the price languished till 02:04, when it leaped 1.05%, turning momentum around and gaining 0.75%….only to fall yet again by 1.4% to $47.07. This decline happened without bullish resistance, since the price was tightly congested.
Since then, yet again, price has been rising, by 0.9% to $47.50, at 6:17 EDT.
Fundamental Variables Abound
There are so many fundamental variables driving oil right now, even as opinions about the latest Gulf rupture vary: supplies will be interrupted; no, they won't be; the crisis will destabilize OPEC; no it won't because Qatar is a minor player; rising US production will keep oil supplies flowing; a potentially contracting Chinese economy will depress oil further. Who knows.
If there are so many variables to consider, is there anything we know with certainty?
It's All About Price
We know from moment to moment what price the market will bear. And that tells us the sum of the market's supply (potential sellers) and demand (potential buyers). Volatility, momentum and trajectory are the signals.
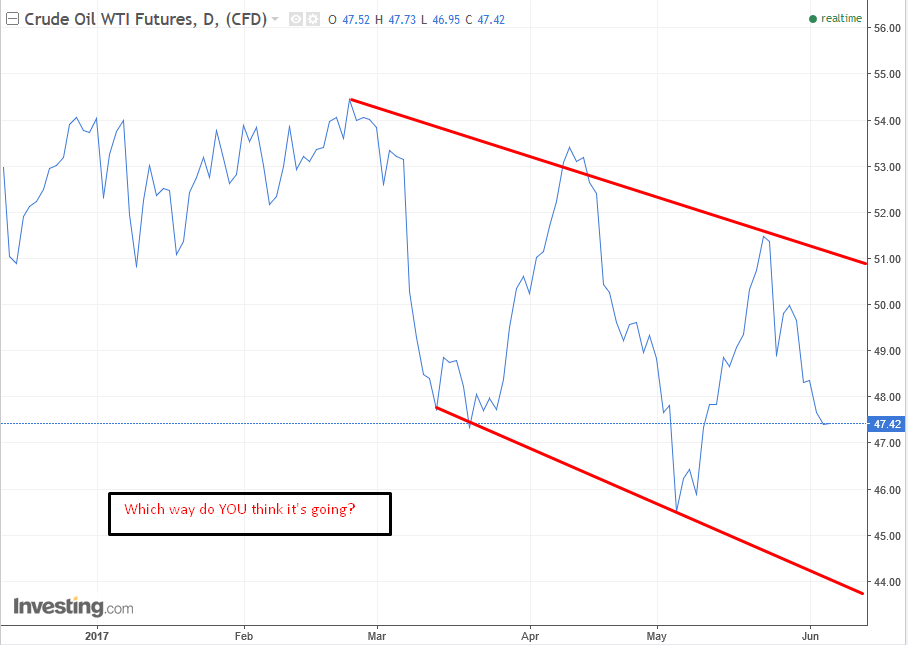
Volatility has been declining since the spikes of March, when the Trump Reflation ended and investors went risk-off.
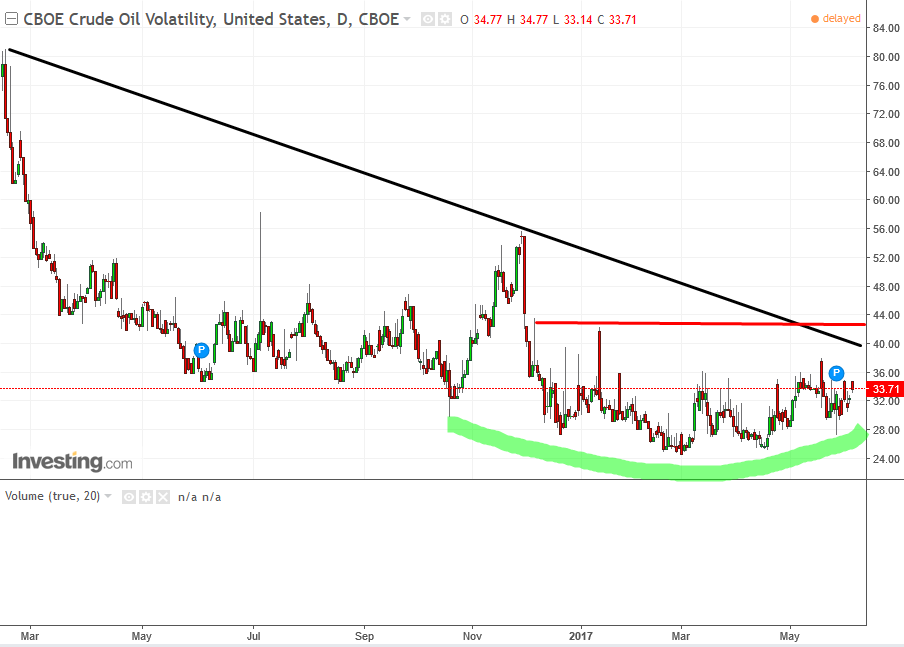
Via the Oil Volatility Index, above, you can see that the commodity spiked last November, after the historic OPEC / NOPEC production freeze deal . Since then, except for a few attempts to return to its downtrend line in the early part of the year, it has completely calmed down.
As a matter of fact, it may have just bottomed, in what might prove to be a Rounding Bottom. Crossing above the black downtrend line, now at 40, would be the first indication of a reversal. Crossing above the red line, resistance since the OPEC / NOPEC spike, at 44, would be the second signal. If oil overcomes the $56 level, all hell would break lose since that would be a retest of the OPEC / NOPEC spike.
Trading The Momentum
The price of oil has dropped over 10% since the May 25 OPEC deal in which Russia’s proposal of an option for an additional 3-month extension was rejected and cuts weren't deepened.
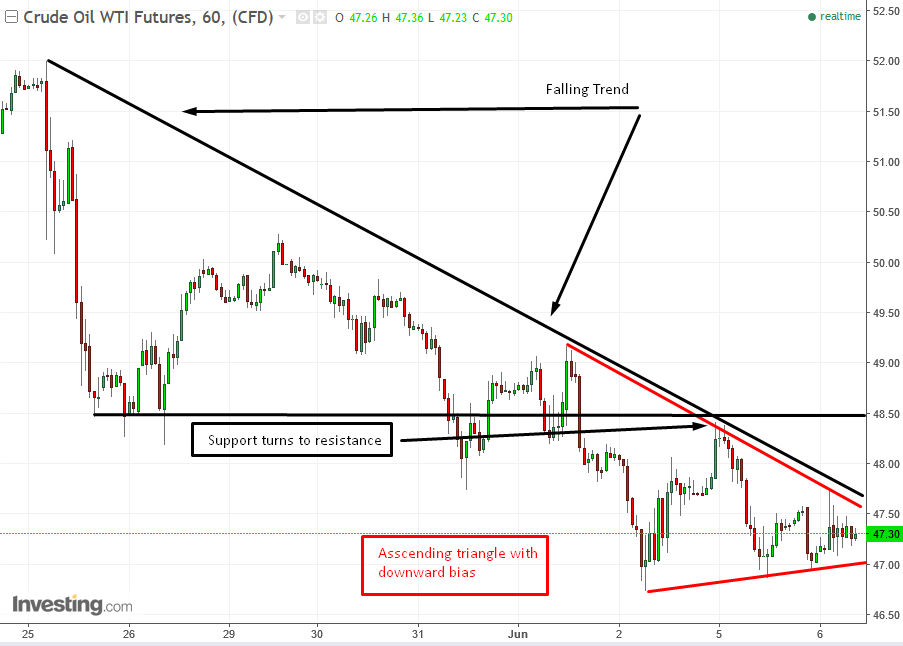
In the chart above, note how the trendline coincides with a downward-biased symmetrical triangle. A symmetrical triangle is considered a continuation pattern, because supply is willing to sell at ever lower prices even as demand is willing to buy at ever higher prices, demonstrating that both equally are eager to stay on their trading course.
Since this particular symmetrical triangle is much steeper on the supply side, it signals over-eagerness on the part of sellers. A symmetrical triangle is a continuation pattern even when both sides of the triangle are equally steep. In this particular case, however, there's a stronger supply side, making it nearer a Descending Triangle, which is wholly bearish.
However, for the pattern to complete, it requires a decisive breakout, at this angle, a downside breakout, which would indicate a resumption of the downtrend. That would probably be beneath $46.75. An upside blowout would probably be at $47.75, per this angle. Keep in mind that should the price continue to languish past the apex, the entire pattern’s potency will dissipate.
Trading Oil in Euro
If you’re concerned about the damage Comey’s testimony on Thursday could cause the US dollar, you can trade oil in euro.
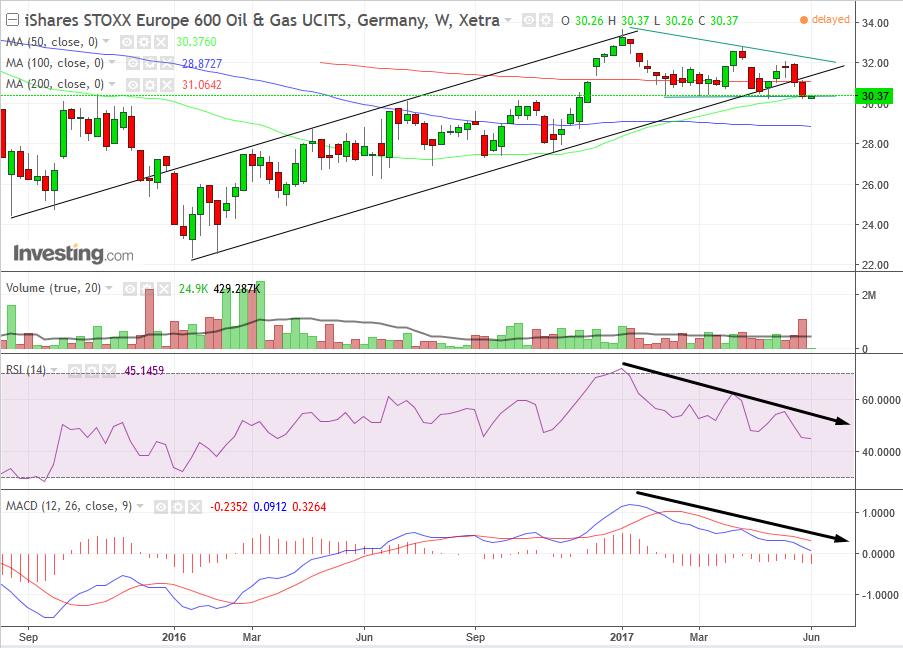
Yesterday, the German, iShares STOXX Europe 600 Oil & Gas UCITS ETF (DE:SXEPEX) which tracks European oil and gas stocks, crossed below its rising channel, which may have completed the notorious descending triangle. A close below 30 would, however, be a more decisive breakout.
Note the spike in volume accompanying that break. It's very important since it projects the potency of participation of the price decline. Should this break down, the target implication, per the height of the pattern, is 27.
