by Pinchas Cohen

According to mutual fund manager and Baron Capital founder Ron Baron, blue chip stocks will double in value by 2030. He believes that interests rates and oil prices will stay low for a “very long time,” boosting the market over the duration.
He expects Tesla (NASDAQ:TSLA) to do even better. Its Model X was just rated the safest SUV on the market, with five stars in every category. Analysts at Germany's multinational Berenberg Bank said that Tesla will have “near monopolistic “control of the electric car market, because, while competitors opted for a low risk / low investment approach, Tesla is all in; it will invest approximately $32.7 billion in its automotive mission over the next five years, 40-percent more than Daimler (OTC:DDAIF) and Volkswagen (OTC:VLKAY) combined.
Traders and investors are paying attention. Yesterday, the stock recovered handsomely from last Friday's tech sell-off and closed at a new high, a mere .92 below its pre sell-off, intraday high of 376.87.
Is It Time To Buy Tesla?
With such stellar ratings, and such high expectations, it's natural to assume that perhaps now is the time to buy Tesla, before shares inevitably catapult higher. Well, maybe...or maybe not.
There is an old Wall Street adage: “Buy on the rumor, sell on the news.” Which means, by the time the news is out it may already be too late. In fact, there have been plenty of Tesla buyers recently. After the ratings news it's more than likely some will become willing sellers, happy to sell to unsuspecting buyers, at a handsome profit.
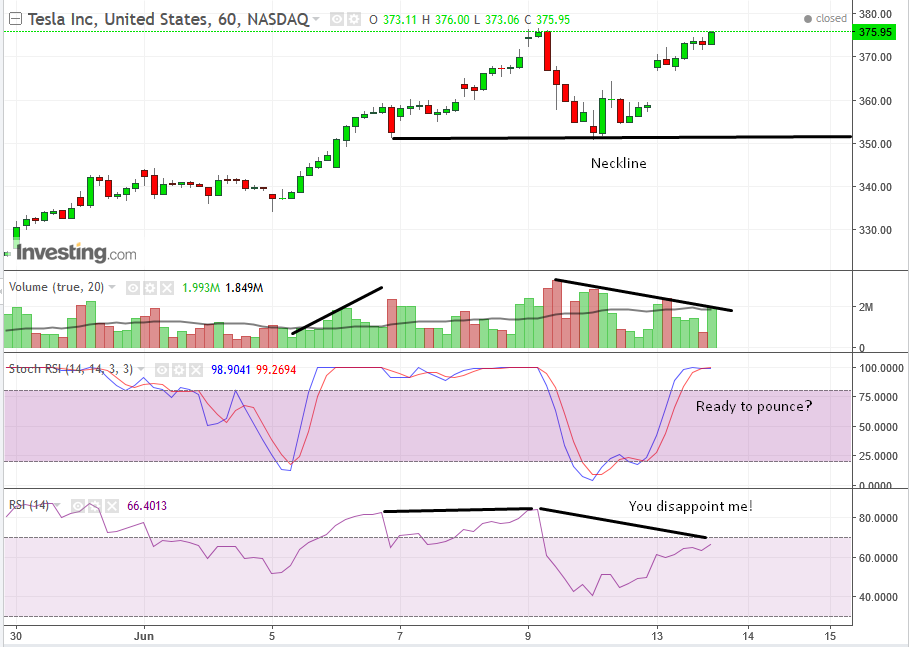
As mentioned above, prior to the tech sell-off, the stock hit an intraday high of 376.87. Yesterday’s 4.7 percent leap to 375.95, formed a beautiful, solid green candle, which indicates that bullish investors encountered no bearish resistance trading it from the bottom up, stopping right near last Thursday's top, at the pre sell-off high. That strongly suggests that investors came in with sell orders, which swallowed any demand at those price levels. This is called resistance.
Although, it requires a break of the neckline, the support of the previous trough, this dead-stop, right under the high of the previous week, creates the potential for a double top. If that sounds crazy, ask yourself why the volume decreased while the price increased?
Could this be a clue that whoever wanted to buy on the news already did so, and is therefore not contributing to the volume? Classically, a market top occurs after the participating public—who buy on the release of good news—discover they have no one to sell to and are left holding the bag. That’s when the panic starts.
Although the RSI was rising along with the upward movement in price, why did it fail to reach its former peak, even as the price hit its earlier high? The leading indicator’s negative divergence displays momentum weakness. The Stochastics of the RSI have reached 100, signaling Tesla is as overbought as it can possibly get. Indeed, Stochastic RSI looks like a poisonous snake, about to pounce.
Note that on June 5th, the Stochastic RSI also peaked yet the stock price advanced. True. But take a look at volume. On June 5th, volume was rising, in support of the price. Now, volume is declining, which means it's not supporting the price.
Make no mistake, this is a contrarian perspective, and not for the faint of heart. However, managed properly these can be the most rewarding positions.
The Contrarian Trade
Conservative traders won't have the nerve for this and would be happier staying on the sidelines.
Moderate traders may wait for a continued climb toward Thursday’s high before they short, but considering it’s so close, if you do that, you're really a conservative trader, so see above. If you want to get in here, caution regarding taking this position isn’t relevant for the entry but rather for the exit. How far out are you willing to place your stop-loss, and how far along will you be willing to ride it down, providing this contrarian position works out?
The $350.93 level is where the neckline sits, the previous trough. It’s also above the $350 psychological support. Depending on a trader's level of caution, many would probably exit as they near that level. Some might divide the 2,500 points, 6.5% target into sections of risk aversion, as well as split their position size throughout the move, providing it falls.
Aggressive traders may opt to short heavily—while placing a stop loss with a tolerable loss—and ride it all the way down to the neckline. They would then consider whether they want to cash out and wait for the neckline to break, as a signal to re-enter or just stay on it, perhaps moving the stop loss closer. Of course, they can also cash out some of the profits, providing this contrarian position pans out.
