by Pinchas Cohen
Value vs Expectation
Sometimes stocks rise on value, which is the subject of fundamental analysis, other times they rise on expectation, the subject of technical analysis. While fundamental analysis seeks to determine the innate value of the real asset, then wait for its financials to catch up, the technical analyst seeks to determine the value investors anticipate for financial asset itself.
One plays the cards, one plays the man. So which is better?
That’s like trying to gauge which martial art is better, while different fighters attain different levels of mastery. Sometimes fundamental and technical analyses agree, and sometimes they don’t – as each focuses on a different aspect of market dynamics.
Will Earnings Disappointment and Higher Interest Rates Cause a Selloff?
Fundamental analysts for the big four US banks see potential for earnings disappointing in the second half of the year, after a relatively strong first half for financials; some, such as those at Citi also consider rising interest rates a potential catalyst for a stock market sell-off.
Fundamental analysts everywhere are expecting disappointing results from all banks (which has become the new normal since the crisis) as a result of weaker trading revenue and low long-term rates. They also expect mortgage originations to be sluggish. The Mortgage Bankers Association has revised down its forecast to $1.56 trillion, which is down 8.2% from $1.9 trillion in 2016.
While Citigroup (NYSE:C) competitors JPMorgan Chase (NYSE:JPM) and Wells Fargo (NYSE:WFC) are seeing declines in mortgage income, Citigroup continues to move further away from mortgages altogether.
Market Rotation Out of Tech, Into Financials

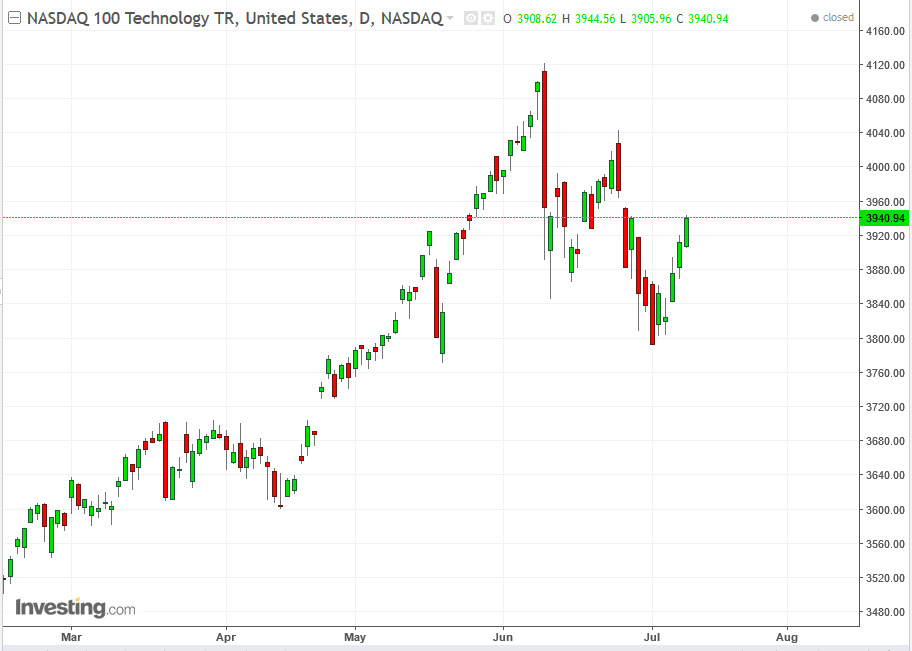
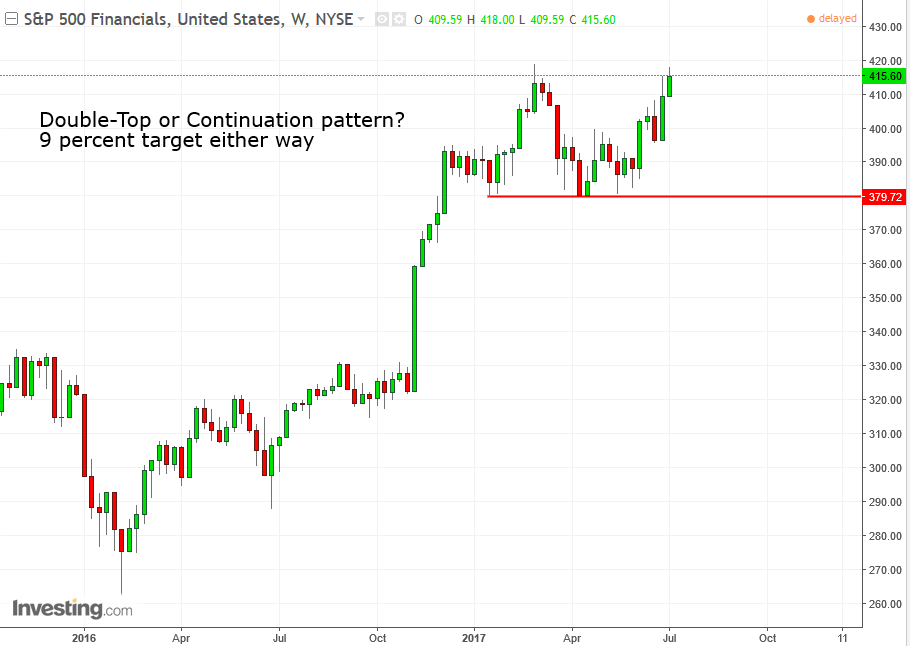
Though Citi may consider rising rates a threat to the stock market, any hikes will be good for bank sector earnings. This brings us to the recent stock market leadership rotation out of the technology sector and into financials, which completed a top on the NASDAQ while a top was still forming on the S&P 500 which still needed to prove itself by advancing past its former March Peak (below).

So let’s assume that earnings will disappoint when Citi reports on Friday. Is that the whole story? As Citigroup itself says, higher rates can be the catalyst for a major correction in a market that hasn’t seen one since the 10 percent selloff on December 2015. Additionally, this is the second longest running bull market in the history of the US market, thanks to extended QE and extremely low interest rates. Which means the odds increase proportionately that this bull could be coming to its end, especially with the Fed shrinking the balance sheet and hiking rates.
Irrespective of past earnings (aka fundamentals), if investors truly anticipate that the increasingly intense rotation into financials that began on June 9 will follow through, bank shares could rise solely on that—the technicals.
Wells Best Earnings Expectation, Citi Best Stock Demand Expectation
Therefore, though Wells Fargo is expected to provide the best earnings and revenue numbers when the banks report on Friday, Citigroup's technicals provide the best picture of investor anticipation. So let's analyze Citigroup.

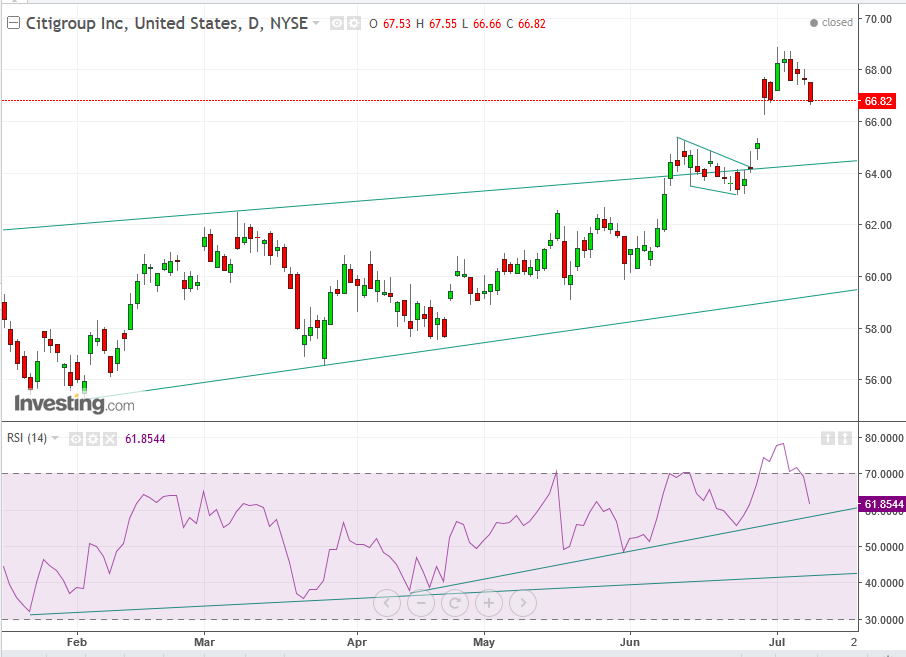
Citigroup’s trading pattern broke out of its moderate rising channel, which suggests a steeper climb going forward. This may be preceded by a minor correction. That would jibe with fundamental analyst expectations of all-around disappointing earnings for banks.
The price of Citigroup has been trading within a mildly rising channel this year, in which it gained 16% in value from the February's $55.23 low to $64 in late June. After that, it broke out of the channel, crossing through the resistance of its top, now expected to turn to support, as it continues to climb more steeply. It climbed 7.5 percent in just four trading days, which included a 3.75 percent gap on June 29.
Fundamentally, the rising gap occurred on the bank’s overwhelmingly successful stress test which the Fed released on June 28. This was followed by Citigroup’s commitment to repurchase up to $15.6 billion of common stock over the next year and double its quarterly dividend to 32 cents per share, bringing total payouts to $18.9 billion. Technically, the gap followed a breakout of a bullish falling flag, a continuation pattern.
Breakout Gap's Red Flag
The flag’s upside breakout gap raises a red flag. After the gap, prices extended gains over the following 3 days, all of which were lost in the following 4 days. In fact, yesterday’s closing price of $66.82 is lower than the closing price on June 29 after the gap at $66.98.
While the decline in itself doesn’t negate the bullish implication of the channel breakout, the breakaway gap could turn out to be an exhaustion gap, a prelude to an Island Reversal, to be completed with a second, falling, gap. And what better catalyst for that than a disappointing earnings report? The price hovering right at the top of the gap suggests that investors are waiting for earnings, in order to figure out where to go from there.
First, the preceding trading doesn’t support the case of an exhaustion gap, which follows earlier gaps, when none occurred. It’s called an exhaustion gap because it’s the last gasp for demand which comes at the top of a frenzied buying spree.
That doesn’t seem to be the case here, as the gap actually followed the flag – a consolidation, by definition – as well as congested trading since April. We also know the fundamental reason for the gap and it's justified.
Second, even if it does turn out to be an exhaustion gap, after a falling gap would complete an island reversal, its downside implication is no more than the rising gap. That would put it right on top of the support of the channel top, from which it would be expected to resume its uptrend.
Trading Strategies
Conservative traders would probably wait on a long for a potential island reversal and a return to the support of the channel top, which would be around $65.
Moderate traders are likely to wait on a long for a potential dip toward the June 29 low of $66.26, before earnings.
Aggressive traders would go long now, in case of an earnings surprise, which would be a catalyst for a price jump, while placing a stop-loss as far below as possible toward the $65.36 bottom of the gap, a support, or even to the channel top, on $64.50, per the current angle. Traders: it’s bad enough to lose money when you’re wrong, but it’s horrible to lose money when you’re right. That’s what would happen if you don’t protect your trade with the appropriate stop-loss.
Very Aggressive traders would short the stock, on the impending fundamental disappointment compounded by the falling gap potential of an island reversal, before going long. Also, the RSI provided sell signals when it fell after reaching its most oversold read since the Trump election.
