Today's market theme is not only an escalation of the US's trade war with China but the Trump administration's expanding trade war against Europe and Japan as well.
After news that President Donald Trump ordered an examination into tariffs of up to 25 percent, according to the Wall Street Journal, Toyota (NYSE:TM) shares fell in after-hours trading as much as 1.7 percent at one point.
In Tokyo, Toyota (T:8015) stock fell 3 percent today and closed at the bottom of the session. After Trump's tweet that "there will be big news coming soon for our great American Autoworkers. After many decades of losing your jobs to other countries, you have waited long enough," it is all but certain that Toyota will continue to plunge in today's US session.
The question is whether traders will chase the trade, entering too late, or whether the decline will likely continue.
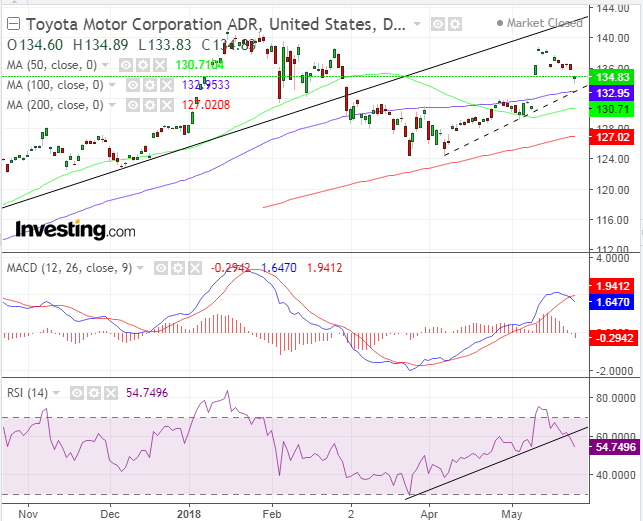
The price of Toyota has crossed below an uptrend line since the mid-2017 bottom, providing a first signal that something may be amiss with the supply-demand balance. A second signal came when the 50 DMA (green) crossed below the 100 DMA (blue) mid-April, even as prices advancing toward the January 17, $140.99 high. A third signal flashed red when the advance failed to make another high, above the preceding, January peak, ebbing out upon approaching the broken uptrend line, a resistance from the downside, and resumed a 3 percent decline.
The final signal that a reversal has been established is when the preceding, March 23 low of $124.46 is breached. In testimony to the finality of that price level, the 200 DMA (red) has moved to 'guard' it.
Both the MACD and RSI provided sell signals. The MACD's shorter moving average crossed below the longer moving average in a demonstration that current prices are falling relative to previous ones. When this crossing takes place upon a rise it signals a reversal in the supply-demand balance. The RSI crossed below its momentum based uptrend line, after reaching the 75 overbought level, suggesting that the price would cross below its (dotted) uptrend line since early April.
Trading Strategies – Short Position Setup
Conservative traders would wait for a 3 percent penetration filter of the March trough to $120, followed by a return move to the $125 area, which would retest the resistance with at least one long red candle engulfing a preceding green candle.
Moderate traders may feel comfortable enough to short upon crossing below the 200 DMA.
Aggressive traders may risk a short with a crossing below the $132 dotted line since early April.
Equity Management – Conservative
- Entry: $124
- Stop-Loss: $125
- Risk: $1.00
- Target: $120
- Reward: $4.00
- Risk-Reward Ratio: 1:4

