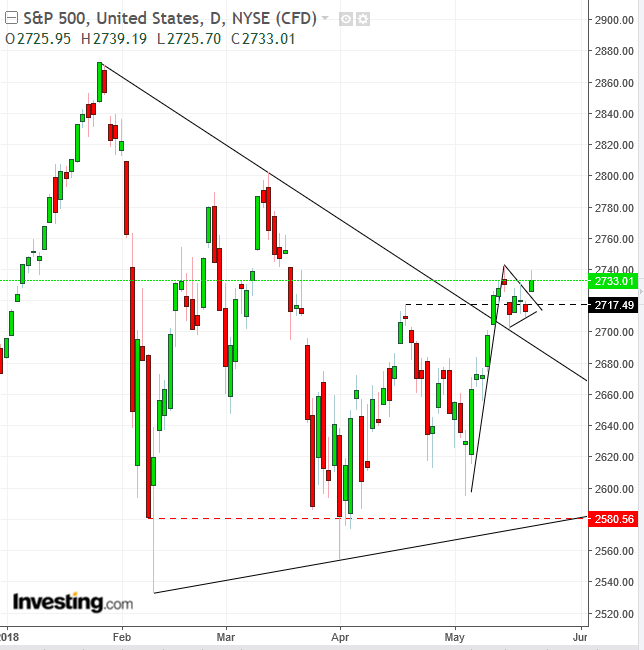
Since its January record, we've been paying particular attention to the nature of the S&P 500 consolidation. We've noted the ongoing debate among technicians regarding whether it should be viewed as a neutral symmetrical triangle—when considering the extremely deep intraday low of February 9 as an outlier—or, by excluding the February 9 and April second lower shadows, should it be deemed a decisively bearish descending channel.
The former is neutral, as it portrays both supply and demand. The latter is bearish, as supply is seen to encroach upon demand.
Ongoing geopolitics have also been whipsawing the US benchmark index, adding to the uncertainty. On May 10th, the price provided an upside breakout, led by energy shares, after US President Donald Trump announced that he was withdrawing from the Iran nuclear deal, and by reimposing sanctions against the world's third largest oil producer, was cutting a million barrels of oil a day from the global market.
However, stocks lost their gains a week later after US 10-year yields hit a seven-year high, when US retail sales rose during March and April, reawakening off-and-on inflationary fears which began when yields first spiked in late January, sending stocks at that time to their first double-digit correction since the late 2015-early 2016.
A secondary pressure weighing on stocks were recent statements by both US Commerce Secretary Wilbur Ross and US Ambassador to China Terry Branstad that trade tensions between China and the US are not going away any time soon.
It was therefore apt that yesterday the SPX jumped following the announcement of a trade truce, albeit one that's likely temporary. In the run-up to the June 12 meeting between the US and North Korea, it's in Trump's best interest to present a peaceful face to China, the Asian nation that wields unparalleled influence with North Korea’s leader Kim Jong Un. Reports have surfaced, however, that Trump aides are growing skeptical that this meeting might ever take place given increasing concerns about the agenda for the summit and the acceleration of harsh rhetoric from North Korea.

Fundamentals may be painting a somewhat bearish picture, but technical signals are telling another story entirely. Yesterday’s rally provided an upside breakout of a continuation pennant pattern, which is itself an upside breakout of what appears to be a symmetrical triangle since late January—after the May 10 upside breakout—turning it into a continuation pattern.
Since the pattern follows an uptrend, it is expected to continue higher. However, a bull-trap is still possible as the penetration reached only 1.25 percent, satisfying only an aggressive, 1.00 percent filter. Having said that, the pennant breakout lends more credence to the larger, symmetrical triangle’s breakout.
Targets:
The pennant’s implied target is a retest of the 2,872.87 high of January 26, while the triangle’s implied objective would be breaking the 3,000 barrier.
Trading Strategies – Long Position Setup
Conservative traders may wait for a three-percent penetration to 2,790, in effort to filter out a bull-trap from the symmetrical triangle’s outside breakout
Moderate traders would wait for the 2742.10 pennant top to be penetrated, preferably on a closing basis, to confirm its upside breakout.
Aggressive traders may act now, provided they can afford a stop-loss below the 2,715 pennant’s apex, if not the 2,660 symmetrical triangle support, or accept the risk of a losing position.
Equity Management
- Entry: 2,733
- Stop-loss: 2,700 Risk: 33 points
- Target: 2,833 (March 13 high)
- Reward: 100
- Risk-Reward Ratio: 1:3
