Oil's price collapse this past spring, as the pandemic ravaged global economies, dramatically reduced the value of the Mexican peso.
The commodity's crash—at one point the oil price dropped into sub-zero territory—meant oil importers had to buy proportionately fewer dollars, the currency in which global oil trades are denominated, with which to pay for Mexico’s crude. The peso went into free fall, tumbling to a record low of 24.2 per dollar, for a YTD decline of 22%, the third worst FX performance in the world, after having had the third best currency market showing in 2019.
With oil now having recovered to +$40 levels, the Mexican peso has nearly wiped out those losses. Not only does the current market price for oil require foreign importers to buy more pesos, but the Central American country has secured hedging contracts that allow it to sell the energy commodity for $49. That gives Mexico an almost 9% premium over the market price—providing an additional boost to the peso.
As well, Mexico’s once left-leaning president has become a fiscal hawk, protecting the value of the peso, in order to avoid an economic crisis in the country because of the pandemic. Plus, the outlook for better relations with the US during a Biden administration is likely to provide added lift to the peso too.
Finally, from a technical perspective, with oil in an uptrend and the US dollar in a downtrend, the Mexican peso gains yet more heft.

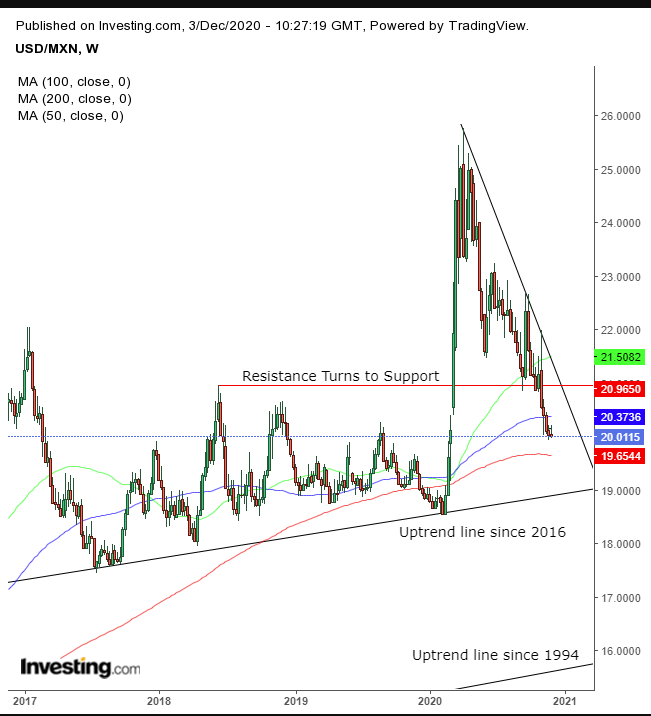
The USD/MXN is headed toward the 19.0000 level, where it will meet the uptrend line since April 2016. Should the current trend prevail, backed by the above fundamentals, a flurry of positional recalibration could push the pair toward the long-term uptrend line since the late-1994 lows, approaching the 16.000 level, per the current angle.
After the peso pressured the dollar below the 21.0000 support and 50-week MA, followed by the 100-week MA, the pair is gaining momentum to cut through the 200-week MA, on the way toward the first uptrend line at the 19.0000 level.
Trading Strategies
Conservative traders would either wait for the price to return to the current downtrend line, which currently meets with the 21.0000 support, or for the pair to fall below the uptrend line at 19.0000.
Moderate traders would risk a short with a retest of the 20.2000 range top or a break through the 19.900 range bottom.
Aggressive traders would short at will, provided they understand and accept the risks and are prepared with a well-thought-out trade plan to which they are committed.
Here’s an example:
Trade Sample
- Entry: 20.0000
- Stop-Loss: 20.2000
- Risk: 2,000 pips
- Target: 19.0000
- Reward: 10,000 pips
- Risk:Reward Ratio: 1:5
Author's Note: This is a trade 'sample.' There are other ways to make this trade, depending upon your budget, timing and temperament, not to mention other strategies. The purpose of this sample is only to showcase the salient points of a coherent trading plan. You should customize the parameters to fit your personal needs. If you don’t know how to do that, practice with small amounts, till you discover what works for you. Trading is hard work.
