by Pinchas Cohen
Strong Chinese Data Lifts Nickel
Base metals are in a decline despite the fact that China’s manufacturing PMI factory gauge unexpectedly rose to 51.9 in November, beating the 51.4 forecast in a Bloomberg survey of economists and 51.6 the previous month. A number higher than 50 indicates improving conditions and China's current growth is near a five-year high. But general consensus over the past few days has been speculating that China's economy is slowing.
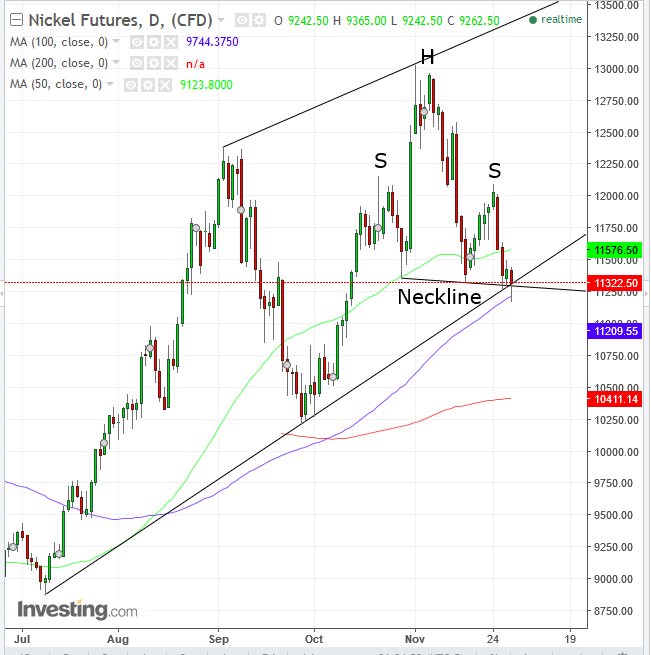
However, the data out of China was enough to push the price of nickel – which was leading industrial metals lower in a four-day decline – back above both the H&S top neckline and its uptrend line since July 10.

A Strong Case For A Reversal
In general, when more than one technical phenomenon occurs at the same time it builds a stronger case. For nickel specifically, the line representing an H&S reversal occurred at the same price level as the line representing the uptrend, making it all the more potent. A simultaneous crossing beneath both would increase the odds of a reversal significantly.
Alternatively, should the pattern fail with a downside breakout (in itself, a bullish indicator) it would compound the support of the uptrend line, signaling a resumption of the uptrend, first testing the November 24, 12,000 of the right shoulder, then the November 1, 13,000 of the head. Additionally, today’s price action (should it close at this price level or higher) will have formed a bullish hammer. As traders say, “it’s hammering out a bottom,” as the bounce forces bearish traders to cover shorts, contributing to the demand.
After falling below the 50 dma (green), the price found support by the 100 dma (purple), which is guarding the uptrend line.
Trading Strategies
If you want to go Long
Conservative traders would skip this trade, as the rally ending on November 24 failed to rise above the former rally, ending on November 6, putting the uptrend in question, forming the right shoulder of a reversal pattern.
Moderate traders may wait for the price to cross back over the 50 dma, now at 11,576.60, as a signal of resuming the current uptrend.
Aggressive traders may take the risk, taking advantage of the extraordinary risk-reward ratio, placing a stop-loss below today’s hammer low of 11,170. The first 12,000 target provides a 1:4.5 ratio, and a 13,000 target provides an 1:11.25 risk reward ratio.
If you want to go Short
Conservative traders would wait on a minimum 3 percent penetration of the neckline, to 10,944, per the current angle; then wait for a full return-move to verify the neckline’s integrity. This will be confirmed by a down-day whose price will be lower than the preceding up-day.
Moderate traders would be content with a 2 percent penetration and a return-move, but not confirming the pattern’s resistance.
Aggressive traders may enter upon a 1 percent penetration and place a stop-loss above the neckline or assume the risk of a return-move.
Target: The height of the pattern suggests a target of 9,550. Traders should take into account that the September 27 high of 10,212.50 may very well provide a strong support.
