By Pinchas Cohen
Six days ago we published our bullish opinion on copper. At that time, we said that fundamentally, China’s growth would increase demand for the red metal. Technically we said it would break out of a consolidation and was set to break out of a 6.5-year falling channel.
This morning, China’s Caixin Manufacturing PMI rose for a second straight month in July, reaching its highest level in 4 months.
Today, another base metal, iron ore, whose price is tied in with Chinese demand, extended yesterday’s 5-percent surge with an additional 3.4 percent to 574 yuan per metric ton on the spot market, the highest point for the commodity in more than four months. Chinese iron ore futures surged 7.95 percent, with their best daily performance since November 2016.
Global equity markets are being led higher by raw material producers. There is, however a bearish view in all this bullishness.
But demand for iron ore’s contracts jumped on concerns of China’s depleting construction supplies, as well as their government's toughening environmental standards. Whole mines have stopped producing, halted by environment inspections, affecting the entire supply chain.
As well, UBS maintains that retail futures traders in China (who make up 70 percent of the Dalian market thanks to smartphone penetration) will determine the direction of the commodity's price. UBS believes this current spike is unsustainable.
In our opinion, the central focus should be on the fact that the Chinese economy is growing at a faster pace than expected, despite the government's ongoing regulatory crackdown.
The price of iron ore has a dramatic effect on Australia’s $1.189 trillion GDP since it's the country's biggest export, worth about $40 billion. China is the number-one importer of the base metal and Australia is the top exporter. In addition, China is Australia’s biggest trading partner. As well, China’s fourth biggest import is iron ore, worth $42.9 billion. It’s clear, therefore, why the Aussie dollar has a strong positive correlation with the price of iron ore.
It just so happened, that the AUD/USD pair bottomed at the end of 2015 and has been trading within a massive year-and-a-half-long triangle reversal, which it broke out of on July 13. It provides a thousand-pip upward target price.
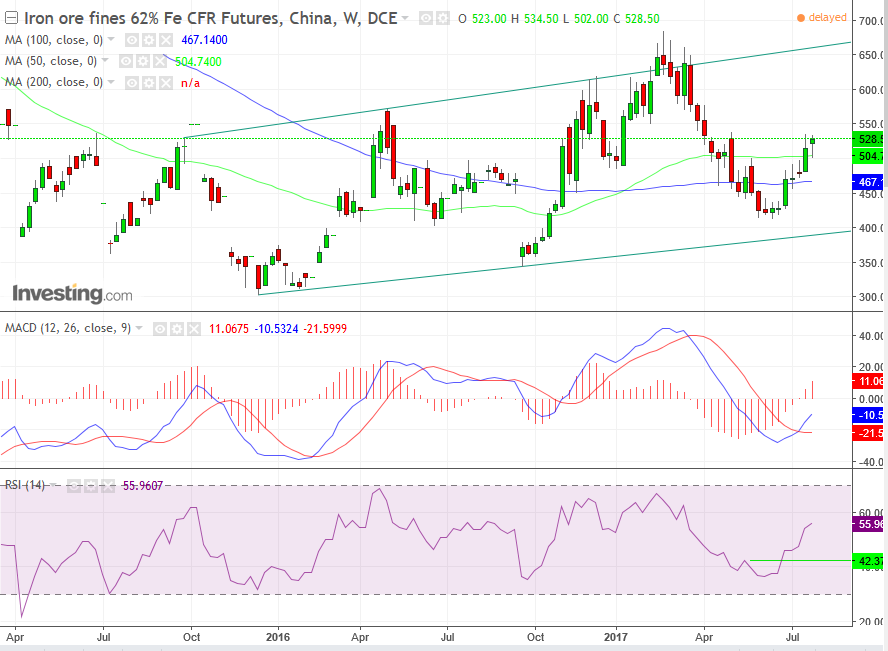
From a technical perspective, the price of iron ore has been trading within a rising channel since September 2015. Since the February 685 high, the price declined nearly 40 percent to its June 412.50 low, which neared the bottom of the channel. The momentum leading indicator provided a buy signal on the weekly chart, when it bottomed in late June.
The statistical price comparisons of different periods by the MACD provided a buy signal in on the weekly chart mid-July, when the more recent price data rose over the longer price data, suggesting prices are now turning up.

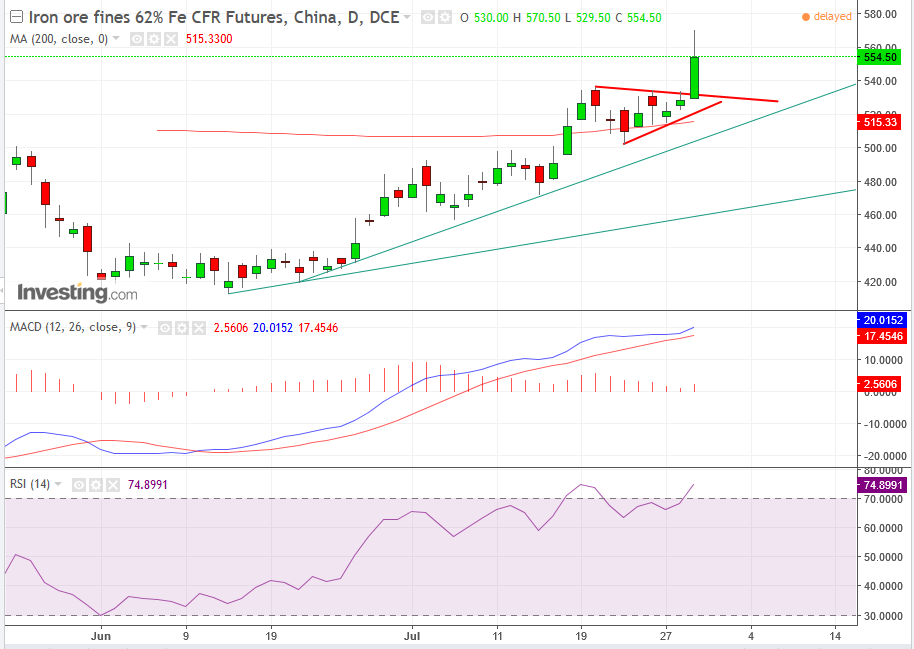
On the daily chart, the MACD and RSI are naturally oversold, after the last surge, while the price crossed over the 200 dma on July 19, from where the price corrected yet remained over the major moving average, confirming the trend.

Between July 20 and 26 the price traded within a pennant, a continuation pattern. This is a take-profit respite, in which traders catch their breath and try to figure out their next move.
The upside breakout of the pattern gets everyone on board with a resumption of the trend before its interruption. The price target is measured by the move preceding the congestion, from the July 17, 481 low to July 20, 536.50 high, or a 55.5 target from the 533 point of breakout to 588.50.
Trading Strategies
Very conservative traders, who are willing to risk capital only on rare bargains, would wait on a long for a potential but unlikely correction to the channel’s bottom, toward 400.
Conservative traders would look at the oversold MACD and RSI and get a case of fear of heights. They are likely to wait on a long for a correction to the uptrend starting on June 14, which is being protected by the 50 dma (green) at the current 467 level which is rising. A closer support would be the steeper uptrend line since June 21, currently at 505, and rising. A closer support still is the 200 dma (red), at 515.
Moderate traders would be thrilled if the price corrected to the support of the pattern at the low 530’s, and would jump on board for a long ride.
Aggressive traders are not known for waiting and may enter a long now.
Very aggressive traders may short against the prevailing trend, on the expectation of the classic return move, before they go long.
Disclaimer: Stop losses should be placed according to the trader’s risk level, per the provided key prices.
