By Pinchas Cohen
USD Strength, Euro Weakness
As opposed to the inability of the S&P 500 Index to hold onto gains, the dollar managed to keep its gains and even extend its longest, biggest rally since February. However, to be fair, it had help. In addition to Yellen’s comments on Tuesday; President Donald Trump’s much-anticipated framework to cut taxes was announced yesterday. Truthfully, that should have helped stocks even more than the dollar. US listed companies would keep 15 percent more of its profits.
Why stocks failed to maintain their gains yesterday, despite both bullish news events is a question investors should ask themselves. One possible explanation is that looking through the prism of higher borrowing costs, stock prices suddenly don’t seem like such a bargain. The remaining question for investors is whether this narrative will take hold and what are its trajectory implications.
At the same time that the USD has been heading higher, the single currency has been falling. It's weakness was triggered by a variety of events: most recently Brexit negotiations stalling after the euro already had taken a hit from the German elections earlier this week which saw that country's far-right AfD party strengthened, which will mean that for the first time since WWII the highly populist, the far right will have a place in Germany's Bundestag.
The election results have also weakened Chancellor Angela Merkel, leaving her temporarily unable to form a coalition. This instability of the European economic engine, Germany, instills considerable uncertainty, which in turn is creating serious pressure on the euro.
EURUSD Double Break

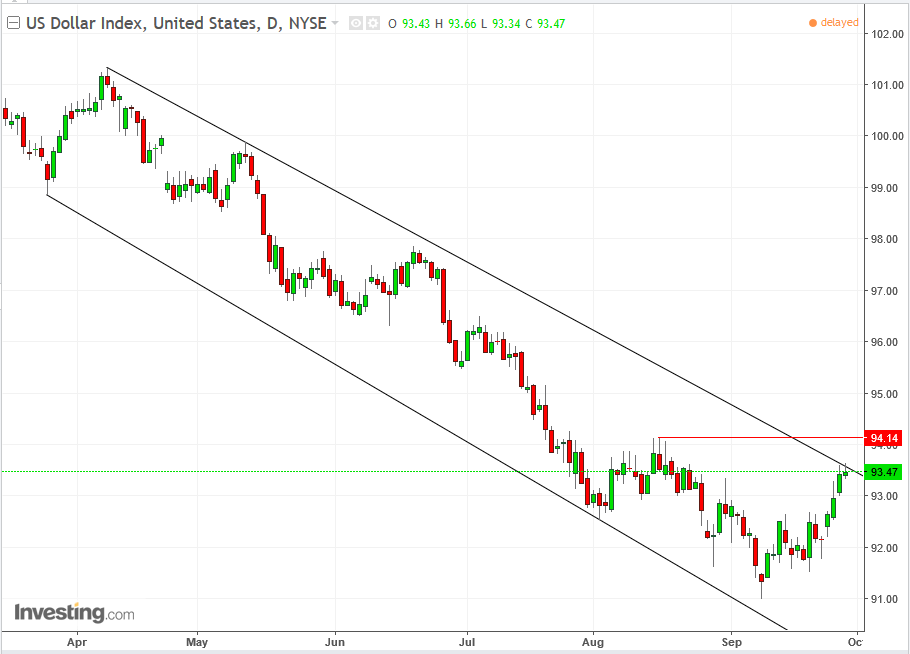
The dollar rally stopped yesterday at the channel-top, a range within which it has been trading since April. Today it rallied, peered above the channel, then fell back down. As well, the August peak resistance 94.00 level will be a test to this rally.

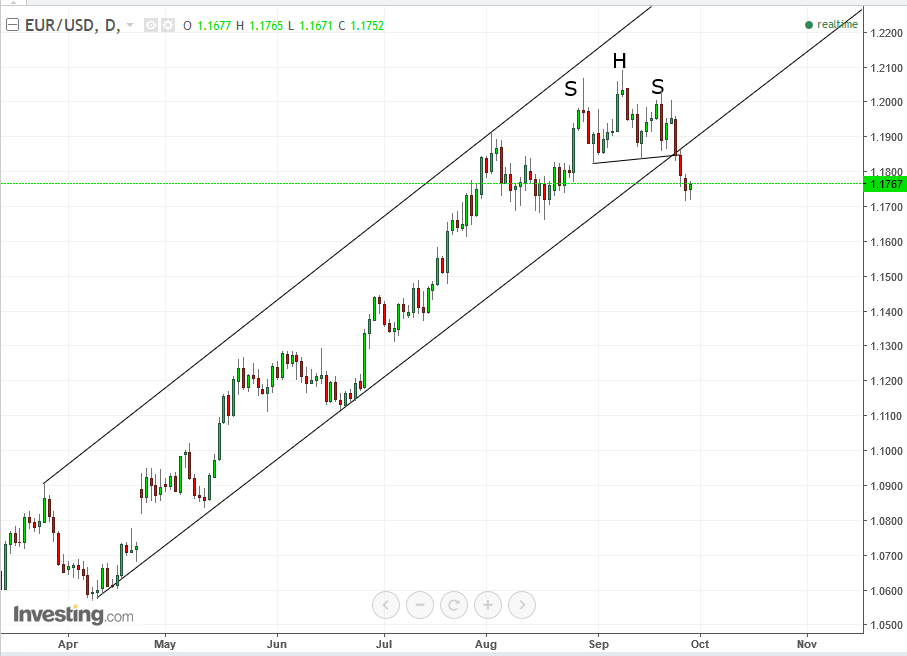
The EURUSD pair performed a double break-out of its rising channel, as well as the H&S top neckline, with a solid (total bear-controlled) candle, moving completely out of the H&S top pattern and the rising channel.
Euro Trading Strategies
Conservative traders would wait for an official reversal signal, when the price registers a series of two peaks and troughs. At this point, all peaks and troughs are in a rising trend. Only after the August 17, 1.1662 trough is penetrated will a first, lower peak register.
Moderate traders would wait for the August 17, 1.1662 support to be violated before entering a short position.
Aggressive traders may wait for a return-move to the neckline, before entering a short.
