Shares of Chinese internet giant Alibaba (HK:9988) jumped on Tuesday, gaining 5.7% during trading in Hong Kong.
The stock has been tumbling as local regulators intensify anti-trust scrutiny into Jack Ma's e-tail empire while also probing practices at his Ant Group payment services company, which has resulted in Ma's fintech company being told to return to its roots and revamp its adjacent business.
Because shares in Hong Kong have plummeted over 15% in just two sessions, bargain hunters have been hovering. Since the stock looks oversold, many appear to believe this is a dip-buying opportunity. We're not so sure.
This sudden shift in Alibaba's (NYSE:BABA) fortunes comes just two months after the stock hit a new high of $319 in late October following its record-breaking $100 billion in sales during Singles Day which began on Oct. 21.
Danton Goel, global portfolio manager at David Advisors, forecasts a rebound for Alibaba shares into the new year. He considers the stock, which closed at $222 during Monday's US trade, to be cheap from a valuation perspective.
Raymond James analyst Aaron Kessler pegs the company at 16 times expected 2021 earnings, very low for a company whose revenue leaped by 30%. As well, Tracy Chen, a portfolio manager for global credit at asset management firm Brandywine Global believes the Chinese government will eventually back off Jack Ma, as the Asian country competes with the US for global tech leadership.
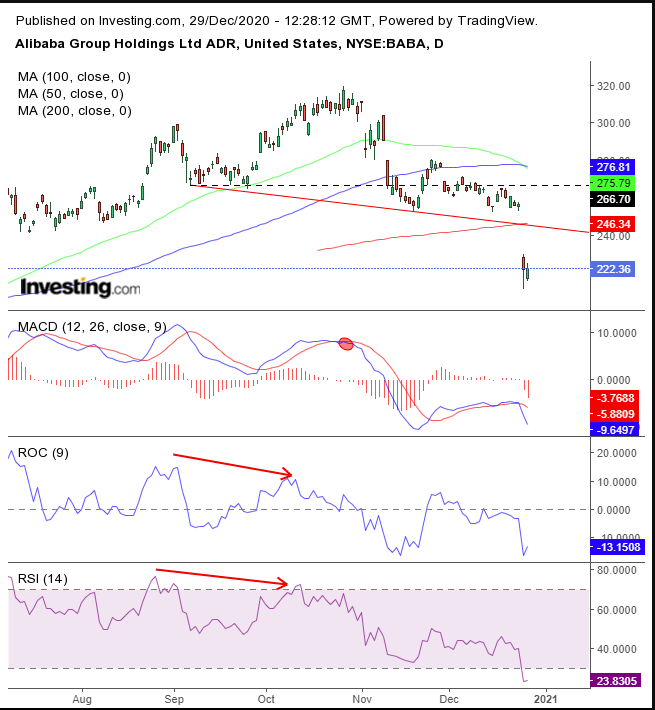
While we have no issue with the prospects for Alibaba climbing back up over the longer term, we're confident, based on the technical chart, it's headed lower first.

BABA just completed a down-sloping H&S top. In other words, the pattern was so weak, it failed to develop the right shoulder at the same levels as that of the left shoulder before supply overran demand.
While the weaker pattern provides a more confident sell call, waiting for its completion—with a downside breakout of the neckline—already ate away some of its profits. Note the black, dotted line, marking where a symmetrical H&S right should be, at $266.70, instead of where it is, at $245. That means short sellers were able to enter a position over $16 lower than if it had been healthy H&S top.
Nevertheless, it’s always fascinating to see how technical pressure points come together in a puzzle-like formation. Note, the 200 DMA met up precisely with the point of the neckline’s downside breakout. At the same time, the 50 DMA broke below the 100 DMA.
Additional confirmation was provided when the MACD’s short MA fell before its longer one, just after the Oct. 28 record, and both the ROC and RSI momentum-based indicators provided negative divergences when the price peaks rose from September.
Yesterday’s pop in the US is merely part of the dynamics that follow an H&S top. Short sellers cover, which includes buying back shares in order to return them to the broker. That pushes the price higher.
Bargain hunters consider it a buying dip, and are lured in, which sets up the short squeeze. Momentum may pick up, until the price returns to the bearish pattern, where an oversupply awaits, pushing the price back down and even lower.
We derive the price objective by measuring the smallest part of the pattern height, which is between its Aug. 28 high of $319.28 and the Sept. 9, $266.70 low, making up $52.58, whereas the initial penetration reached only about $30.
Trading Signals
Conservative traders would wait for a full return move and proof of supply by the pattern.
Moderate traders would also wait for the price to get closer to the neckline, for a better entry, if not for confirmation for the pattern’s integrity.
Aggressive traders would short at will, according to what they could afford and their temperament.
Here’s one an example:
Trade Sample
- Entry: $230.00
- Stop-Loss: $240.00
- Risk: $10
- Target: $200.00
- Reward: $30
- Risk:Reward Ratio: 1:3
