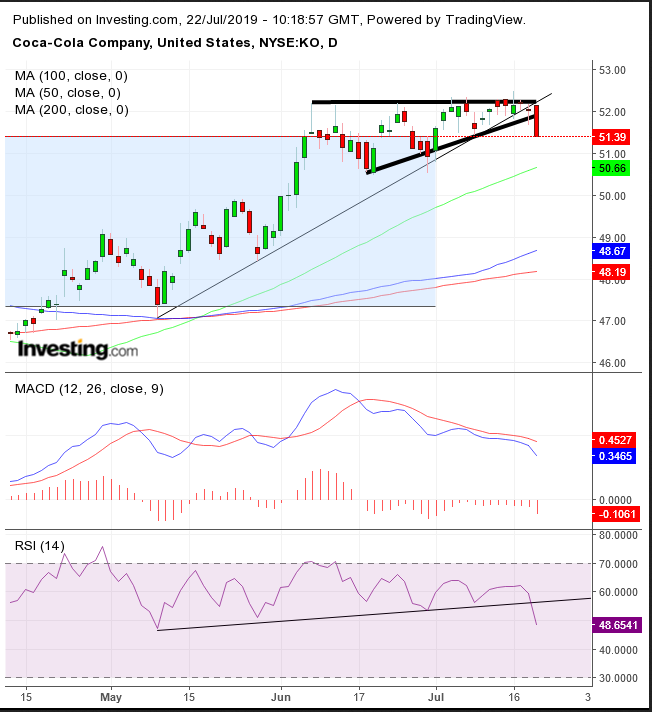
Is Coca-Cola (NYSE:KO) about to disappoint on earnings for the first time in over two years, as the chart seems to suggest?
The beverage giant is due to release Q2 results Tuesday before market open. The forecast is for EPS to be $0.62, little changed since the same quarter last year which provided a $0.61 EPS. Revenue is expected to come in at $9.79 billion, up from last year's Q2 revenue of $8.55B. The company has beaten expectations on both EPS and revenues since the first quarter of 2017, bar Q4 2018 when earnings met expectations.
Analysts have been coming around with a more positive outlook after revising expectations downward following Q1's downbeat guidance—which sent the stock crashing over 8% on the open after the release, despite the company’s raising its dividend payout that month. Now, some say the stock is undervalued, and others even see a catalyst if the company joins the soaring demand for CBD and related products.
Indeed, some analysts now say the stock is undervalued. The shares are up 8.53% year-to-date, lagging substantially behind the S&P 500’s 18.77% gain in the same period. Coca-Cola is also far behind competitor PepsiCo (NASDAQ:PEP), whose stock has jumped 17.75% this year—though technically it may have just topped out.
But if the stock is such a bargain, why are the charts flashing several red flags?

The price dropped below its short-term uptrend line on Friday, potentially blowing out what should have been a bullish ascending triangle, which demonstrates that demand is outpacing supply. However, instead of breaking the topside, the price plunged.
While investors may chalk up Friday’s decline to the general market’s selloff, why then has the MACD’s long MA fell below the Short MA, triggering a sell signal from the very beginning of the supposed bullish pattern, while the SPX’s MACD only did so on Friday?
We don't know that the chart’s weakness necessarily suggests that informed money, or even investors, expect disappointing earnings. It could simply be tracking the broader market’s weakness, but does it matter? Traders' primary interest is only that the trade goes their way.
Trading Strategies – Short Position
Conservative traders would not short the stock before it forms two descending peaks and troughs, establishing a downtrend.
Moderate traders would wait for the price to fall below at least the 50 DMA – if not below the $50 key level – and find resistance below the triangle, with at least a single, long, red candle engulfing a green or small candle of either color.
Aggressive traders would rely on the 1% penetration and the MACD, RSI sell signals, while assessing the optimum entry and stop-loss risk. They would have to assess whether to wait for an upward move to limit exposure, at the risk of losing the position with a continued fall.
Trade Sample – Patience: Limit exposure at the cost of losing the position
- Entry: $52.00
- Stop-Loss: $52.50, above the July 16 high
- Risk: $0.5
- Target: $50.50
- Reward: $1.5
- Risk-Reward Ratio: 1:3
Trade Sample – Immediate Trade: increase exposure to avoid losing the trade
- Entry: $51.50
- Stop-Loss: $52.50, above the pattern’s high (July 16)
- Risk: $1
- Target: $48.50
- Reward: $3
- Risk-Reward Ratio: 1:3
Trade Analysis: Waiting for a potential pullback reduces the stop-loss distance, which requires a smaller target for a minimum 1:3 RRR. The cost, of course, is the potential of a continued decline, losing the trade.
