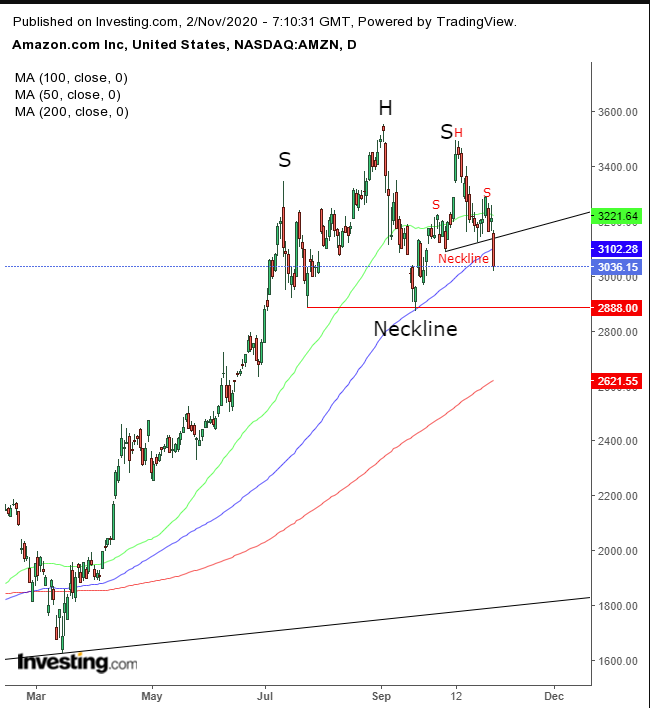
Though Amazon.com (NASDAQ:AMZN) released impressive Q3 results last Thursday, its stock plummeted on Friday, dropping almost 5.5%. The reason? Its guidance, which noted that the size and volume of online shopping during the pandemic may have grown, but CNBC said it "issued a wide profit...range for the fourth quarter, due to higher costs from the coronavirus pandemic."
Nevertheless, the Seattle-based e-tail behemoth hit a number of records. It showed a 37.4% increase in revenue to a record $96.15 billion and a jump of 196.7% in net income to a record $6.33 billion.
And the company's earnings displayed impressive growth as well:
- 37% increase in its third-quarter net sales to $96.1 billion
- 33% rise in net product sales
- 43% leap in net services
- 29% jump in revenue to $11.6 billion for its cloud computing division, AWS, accounting for $3.5 billion in operating income—or over 50% of the world’s biggest retailer’s total operating income of $6.2 billion.
Guidance, however, was the trigger that sparked Friday’s steep selloff: 28% - 38% net sales growth, which was positive, but $1 billion to $4.5 billion in operating income, which the market read as negative, since this translates into a profit slowdown within a range of +15% to -74% on an annual basis.
Given that investors buy stocks for their future appareciation and the company expects its value to slow or even slump, traders sharply sold off the stock on Friday. That selloff completed a small, bearish pattern, whose implied target suggests another, larger bearish pattern is in the making.

Friday’s decline completed a month-long H&S top, itself the right shoulder of a larger H&S reversal pattern, going on four months in the making. If the smaller H&S actualizes its implied target of over $350 dollars lower, based on the pattern’s height (the idea is that position mechanics—unwinding longs and strengthened shorts—would drive the price for at least the same measure that created them within the pattern), it will have also completed the larger top, whose neckline is at $2,888 (red line).
Trading Strategies
Conservative traders would wait for the larger pattern to complete with a downside penetration below $2,800; then wait again for a return move to successfully retest the (red) neckline’s resistance, before entering a short position.
Moderate traders would wait for a return move to limit exposure with an entry closer to resistance, to either pattern.
Aggressive traders might short now, after writing a trade plan that accounts for the risk and sets their target with a risk-reward ratio that allows them to stay on the side of statistics in their overall trading. Here’s an example:
Trade Sample
- Entry: $3,036
- Stop-Loss: $3,136
- Risk: 100 points
- Target: $2,336
- Reward: 700 points
- Risk:Reward Ratio: 1:7
Author's Note: This isn’t the only way to approach this trade. It’s just one sample. You need to draw a plan that fits your needs, including your budget, timing and temperament. For example, you can trade the range between the two necklines for a smaller stake of the trade. Good trading!
