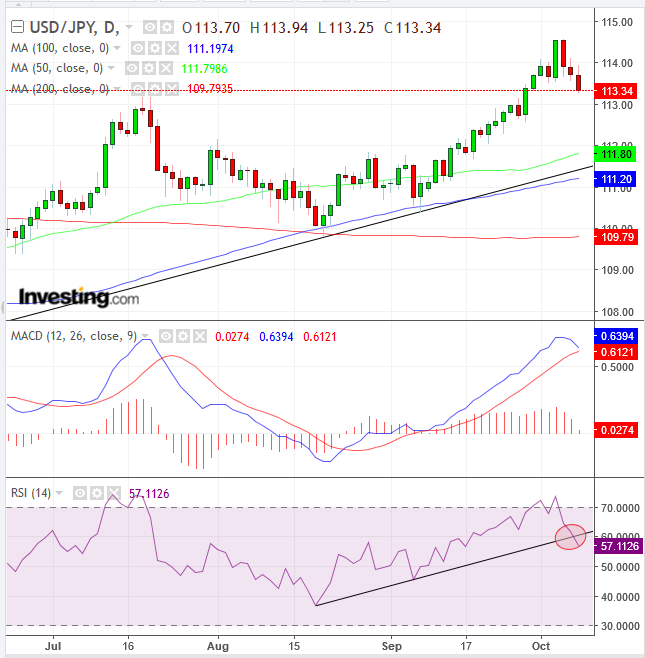
While the dollar has all the fundamental reasons to support an outlook for continued strengthening, it continues to weaken against the yen for the third day.
The dollar is strong and should only strengthen in the coming months for a number of reasons. Firstly, Fed Chief Jerome Powell has set a clear path to higher interest rates. In addition, the US economy continues to publish roaring economic data, including the lowest unemployment in 48 years. In further good news for the dollar, the Treasury selloff pushed yields to a seven-year high, attracting foreign investors who must buy the dollar in order to pay for the USD denominated bond. Finally, the euro has been pressured by an unexpected decline in German industry outputs, which points to further USD growth as the two currencies mirror each other.
So in light of all this good news, why is the dollar falling against the yen?
Multiple headwinds to risk assets are beginning to wear on investors' nerves. The US-Sino trade dispute is only escalating, China's economy is slumping and the threat of increased Euroskeptic sentiment is on the rise due to Italy's budget standoff with the European Commission. As we have previously reported, it appears that as stress levels in the market rise, the yen is reclaiming its position as the predominant safe haven currency, at the expense of the dollar. This is clearly signaled by the fact that even as the dollar rises against other currencies, it's falling versus the yen.

While the USD/JPY pair has been rising since March 26 and Wednesday's peak reinforced the uptrend, having surpassed the July peak, the RSI signaled that prices might fall, as momentum dropped below the uptrend since mid-August. Also, the MACD's short MA has curved downward, about to cross below its long MA, providing a sell signal.
Note that the 50 and 100 DMAs are hugging the uptrend line, revealing its statistical importance for the trend. The 200 DMA (red) marks the price level of 110 as the red line for where the trend reversal might take place, as it supports the previous trough of mid-August.
Still, the recent peak confirms the uptrend, and while there could be a pullback, the preponderance of the evidence indicates that the uptrend will endure, either because of a return to risk-on or because the dollar will remain as a safe haven.
Trading Strategies
Conservative traders should wait on a long position for the MACD and RSI to fall back to normal levels, which should coincide with the price’s correction, back toward its uptrend line, at around 112.00. Then, they might wait for a confirmation of the trend line holding, with at least one long green candle. Finally, they might wait for the price to retest the green candle’s support for added confirmation or for a better entry.
Trade Sample:
- Entry: 112.00
- Stop-loss: 112.50
- Risk: 50 pips
- Target: 114.00
- Reward: 200 pips
- Risk-Reward Ratio: 1:4
Moderate traders may enter a long position upon evidence of consolidation, with at least one long, green candle.
Trade Sample:
- Entry: 113.00
- Stop-loss: 112.75
- Risk: 25 pips
- Target: 114.50, peak’s resistance
- Reward: 150 pips
- Risk-Reward Ratio: 1:6
Aggressive traders may short to ride the potential correction.
Trade Sample:
- Entry: 113.75
- Stop-loss: 114:00
- Risk: 25 pips
- Target: 112.00
- Reward: 175 pips
- Risk-Reward Ratio: 1:7
