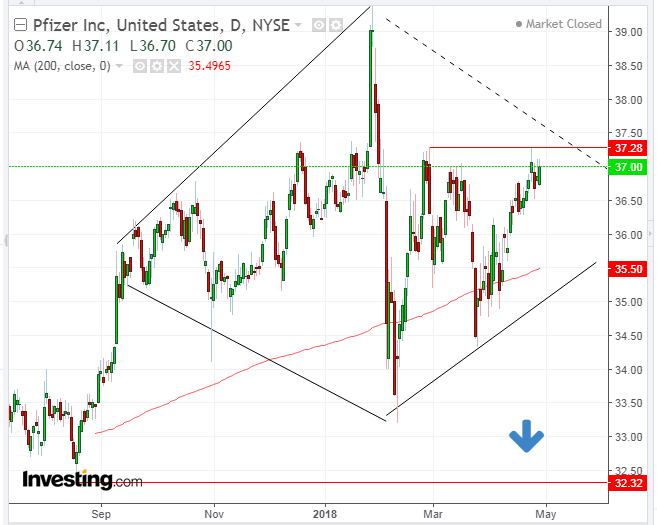
Analysts have recently increased Pfizer Inc (NYSE:PFE)'s EPS expectations from $0.74 to $0.75. Does this updated estimate indicate that the stock will retest its January $39.43 high?
The overall supply-demand balance seems to indicate that it will not.
Pfizer is a Diamond in the Sky that is About to Fall
The price has been developing a diamond top formation. It is rare as it is a profitable pattern, upon the successful downside breakout. The right side of the top is dotted to indicate it is presumptive, assuming the pattern will continue to form and that the former February 28, $37.28 peak will maintain resistance.
This pattern is made up of two smaller ones. On the left side, it started mid-September to develop a Broadening Pattern; on the right side, it began forming what may be a triangle.
The pattern may be described as a Complex Head-and-Shoulders with a V-shaped neckline.
Thomas Bulkowski is an investor and author. His research shows that 58 percent of the time the last rally before the Diamond Top is steep. Between August 21 and September 12, which is less than a three week period, the price surged by more than 10 percent. During the same period, the S&P 500 Index climbed 3.1 percent. An advance three times that of the benchmark more than satisfies the requirement for a steep rise.
When this occurs his research shows that the odds increase that the breakout from the diamond will be downward and will be equally as steep. That means that should the price fall below $36, it should almost automatically fall quickly to the beginning of the last move on August 21 at $32.32.
Pullbacks occur about 54 percent of the time. When they occur, they do tend to detract from performance, in terms of optimum entry. An entry upon breakout with a stop-loss above the pattern should eliminate performance weakness.
84 percent of downside breakouts provide a minimum of a 10 percent gain. The 10 percent failure percentage is 16 percent, below the average for most tops complete with a downside breakout. These numbers render the diamond pattern with an above-average chance of being profitable with minimum risk.
The 200 DMA increases the weight of the evidence that this pattern as drawn is meaningful, as it 'guards' the pattern bottom.
Trading Strategies – Short Position Setup
Conservative traders would wait for a 3 percent downside breakout and for the probable return move, which would demonstrate the pattern's resistance, with at least one red candle engulfing one green candle.
Moderate traders would be satisfied with a 2 percent breakout and might wait for a return move for a better entry.
Aggressive traders may enter a short position immediately, counting on the dual resistance of the former February 28, $37.28 peak. The dotted downtrend line from the January 30 diamond top is presumptive, in case the previous peak would maintain resistance.

