Bitcoin has taken yet another beating. Harvard professor and economist Kenneth Rogoff told CNBC:
“Basically, if you take away the possibility of money laundering and tax evasion, its actual uses as a transaction vehicle are very small.”
Rogoff posits that a global regulations crackdown would trigger a selloff. He said:
"I think bitcoin will be worth a tiny fraction of what it is now if we're headed out 10 years from now ... I would see $100 as being a lot more likely than $100,000 ten years from now.”
Back in October, Rogoff predicted that Bitcoin would “collapse” amid the mounting regulators’ interest in the digital currency arena, before Bitcoin began selling off in December, from where it lost 70 percent of its value, from near $20,000 to $6,000 by February 6.
This pessimistic outlook for cryptocurrencies is just the latest as many big names make dire predictions. While as a former chief economist of the IMF Rogoff’s pronouncement may wield gravitas, crypto bulls might consider him as an authority on traditional assets rather than cryptocurrencies, and consider this short-term decline a buying opportunity.

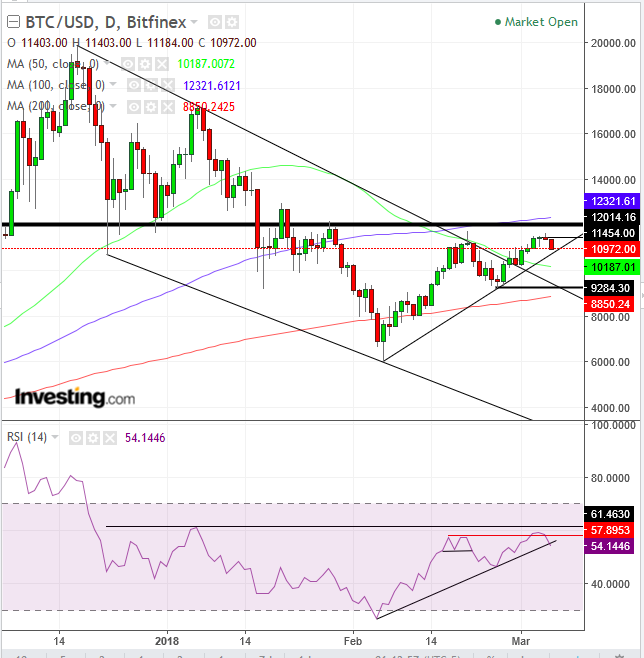
On Sunday, the price formed a hanging man. This pattern is bullish in itself as it demonstrates that after a valiant bearish attempt, it’s the bulls who had the final say, pushing prices all the way back up. However, after a rally, this tug-of-war volatility may signify its end.
Still, because of the bullish closing domination, it requires a confirmation for what may be viewed as a bullish interaction to turn into a bearish signal. That is accomplished when the price of the following session closes beneath the real body of the hanging man. That means that the longs that pushed back the prices to the top of the session are losing and closing position, if not already stopped out. This leaves the bears in charge.
Moreover, not only was there such a confirmation (as the price yesterday closed at $11,416, which is lower than the hanging man’s real body – its opening price in this instance – at $11,497) but the confirming candle was a bearish shooting star to boot, revealing the strength of the resistance of this price level. The oversupply becomes more evident when noticing that it’s at the same price level as the prior peak of $11,776, posted on February 20, also a shooting star. Finally, the $12,000 level has proven a support/resistance level since mid-December.
The RSI is forming a double-top, as its peak peaked above but fell back below its February peak, when it already formed a small double top, from where the price extended the decline another 10 percent. The RSI also crossed below its uptrend line since early February, suggesting the price will follow with its own uptrend line violation, further increasing the odds for a double-top, confirmed when breaking below the $9,284.30 neckline. The significance of this price level is revealed by the 200 dma (red), rushing to “guard” it. It is noteworthy that the RSI has formed a corresponding support/resistance to that of the $12,000 price level.
Trading Strategies – Short Position Setup
Conservative traders would wait for a reaffirmation of the trend, after the price broke above the downtrend line/falling channel top on February 27. This will be done with a peak higher than the former, February 20, $11,776 or a trough lower than the $9,284.30 trough posted on February 25 (the double top neckline). They would employ a penetration filter, including price depth and time, and wait for a likely return move to ascertain the support (on a higher peak) or resistance (on a downside breakout of the neck line), with at least one day’s price range engulfing the previous price range in the opposite direction.
Moderate traders may wait as well for a trend resolution but with a less stringent filter and not necessarily wait for a return move or for its confirmation of support/resistance. Alternatively, they may be satisfied with a close below the uptrend line since February 6.
Aggressive traders may short now, with a stop-loss above yesterday’s $11,544 shooting star, the February 20 $11,776 shooting star, or the $12,000 support/resistance price level since mid-December, depending on their equity management and trading strategy. They may also wait for an advance to retest the hanging man’s-shooting star combo’s resistance at $11,544, either for its confirmation, or for a closer entry, lowering the position’s risk.
Equity Management
If the target is the previous trough of $9,284, they should wait for a rise, to allow them a minimum of a 1:3 risk-reward ratio, relative to the $11,696 resistance of the shooting star, above which the stop-loss should be placed.
However, if they are banking on a downside breakout of the neckline at the same level, they can enter now. The double top completion would imply a $2,460 move with the target of $6,850.
There are many trading strategies available for the same instrument in the same time. A trader must establish a plan, which would include his resources and temperament. This is crucial and determines success or failure.
Pair entries and exits should provide a minimum 1:3 risk-reward ratio. They should suit your time frame, with the understanding that the further the prices, the longer it will take to achieve them. Finally, understand that these guidelines are probability-based, which means by definition they include losses on individual trades, with the aim of profits on overall trades.
