In December of last year, as Congress voted to pass the “Tax Cut & Jobs Act,” I wrote that without “real and substantive cuts to spending,” the debt and deficits will begin to balloon. At that time, I mapped out the trajectory of the deficit based on the cuts to revenue from lower tax rates and sustained levels of government spending.
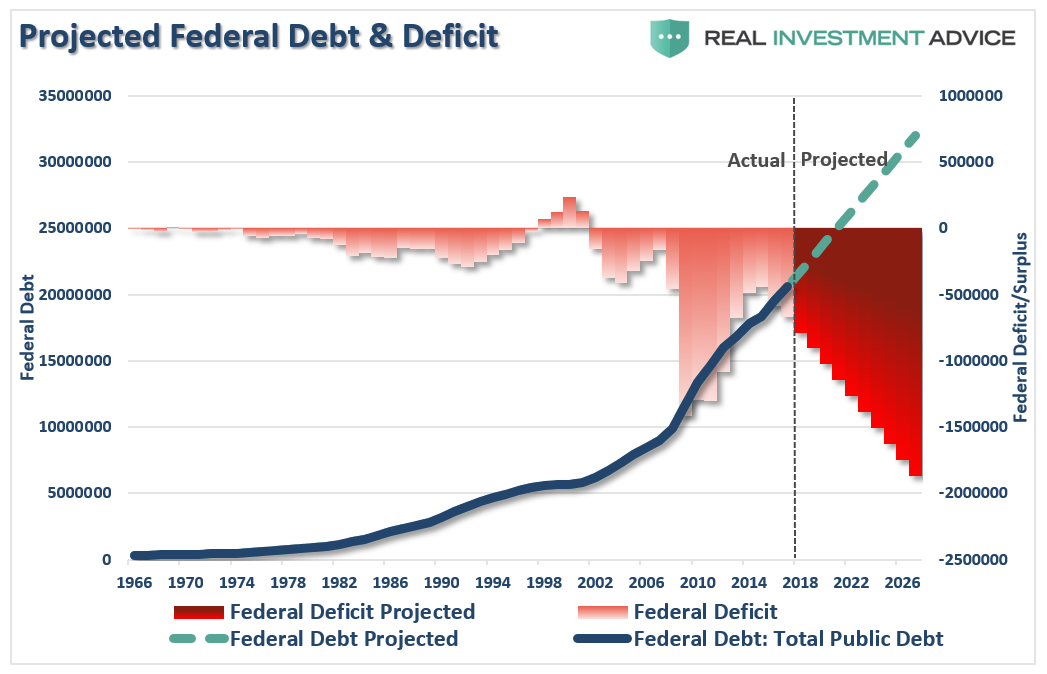
Since that writing, the government has now lifted the “debt ceiling” for two years and passed a $1.3 Trillion “omnibus spending bill” to operate the government through the end of September, 2018. Of course, since the government has foregone the required Constitutional process of operating on a budget for the last decade, “continuing resolutions,” or “C.R.s,” will remain the standard operating procedure of managing the country’s finances. This means that spending will continue to grow unchecked into the foreseeable future as C.R.’s increase the previously budgeted spending levels automatically by 8% annually. (Rule of 72 says spending doubles every 9-years)
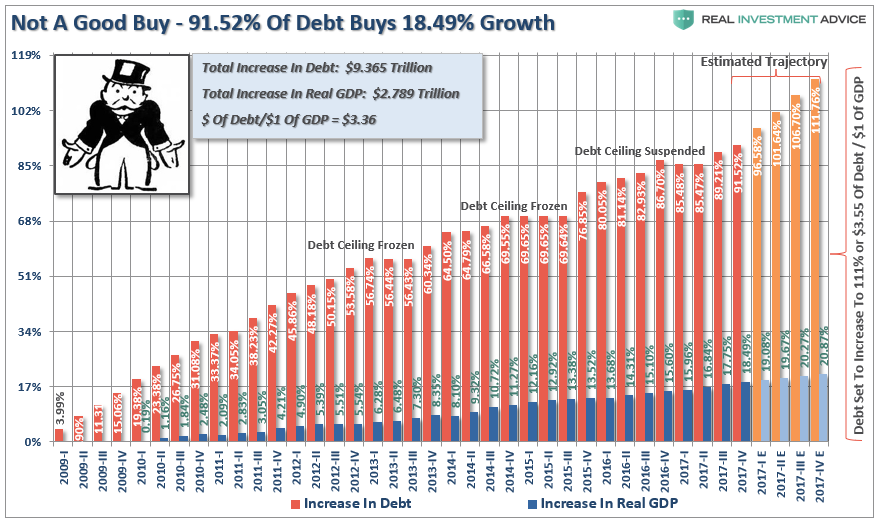
The chart below tracks the cumulative increase in “excess” Government spending above revenue collections. Notice the point at which nominal GDP growth stopped rising.
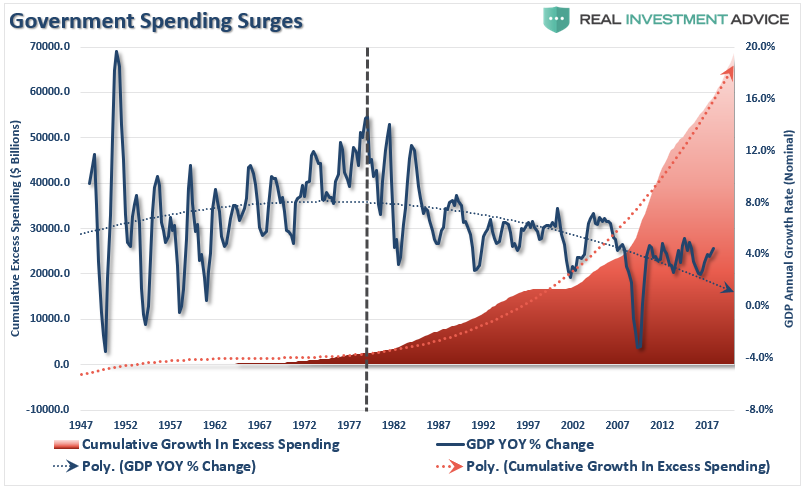
Trillion dollar deficits, of course, are nothing to be excited about as rising debts, and surging deficits, as shown, impede economic growth longer-term as money is diverted from productive investments to debt-service.
While many suggest that “all government spending is good spending,” the reality is that “recycled tax dollars” have a very low, if not negative, “multiplier effect” in the economy. As Dr. Lacy Hunt states:
“The government expenditure multiplier is negative. Based on academic research, the best evidence suggests the multiplier is -0.01, which means that an additional dollar of deficit spending will reduce private GDP by $1.01, resulting in a one-cent decline in real GDP. The deficit spending provides a transitory boost to economic activity, but the initial effect is more than reversed in time. Within no more than three years the economy is worse off on a net basis, with the lagged effects outweighing the initial positive benefit.“
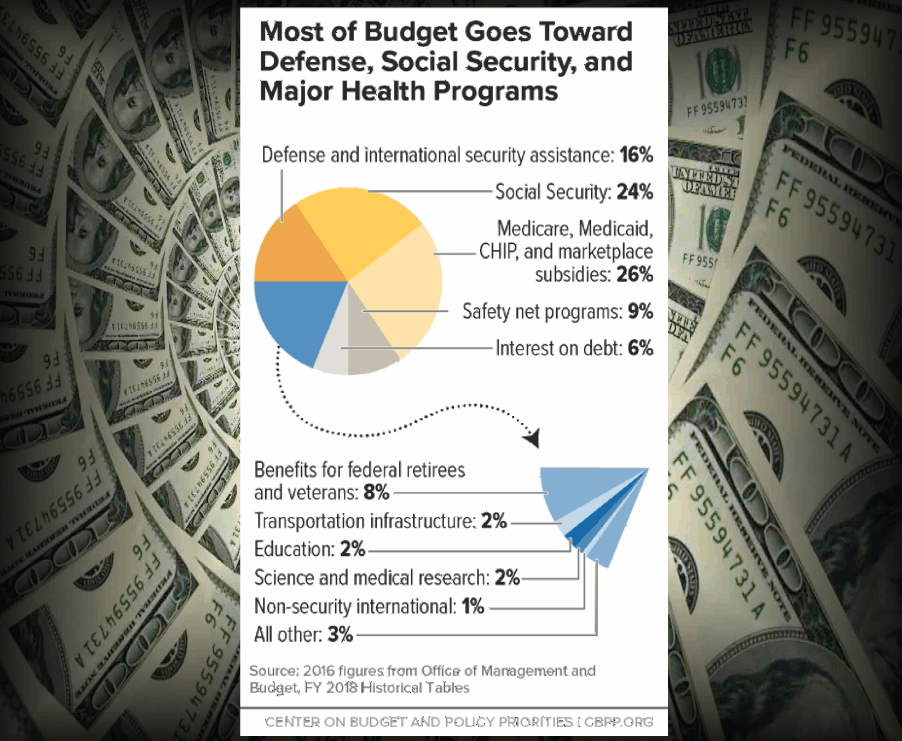
Dr. Hunt is absolutely correct when he notes that due to the aging of America, the mandatory components of federal spending will accelerate sharply over the next decade, causing government outlays as a percent of economic activity to move higher. According to the Center On Budget & Policy Priorities, nearly 75% of every tax dollar goes to non-productive spending.
As Dr. Hunt concludes:
“The rising unfunded discretionary and mandatory federal spending will increase the size of the federal sector, which according to first-rate econometric evidence will contract economic activity. Two Swedish econometricians (Andreas Bergh and Magnus Henrekson, The Journal of Economic Surveys (2011)), substantiate that there is a ‘significant negative correlation’ between the size of government and economic growth. Specifically, ‘an increase in government size by 10 percentage points is associated with a 0.5% to 1% lower annual growth rate.’ This suggests that if spending increases, the government expenditure multiplier will become more negative over time, serving to confound even more dramatically the policy establishment and the public at large, both of whom appear ready to support increased, but unfunded, federal outlays.”
The evidence is pretty clear.
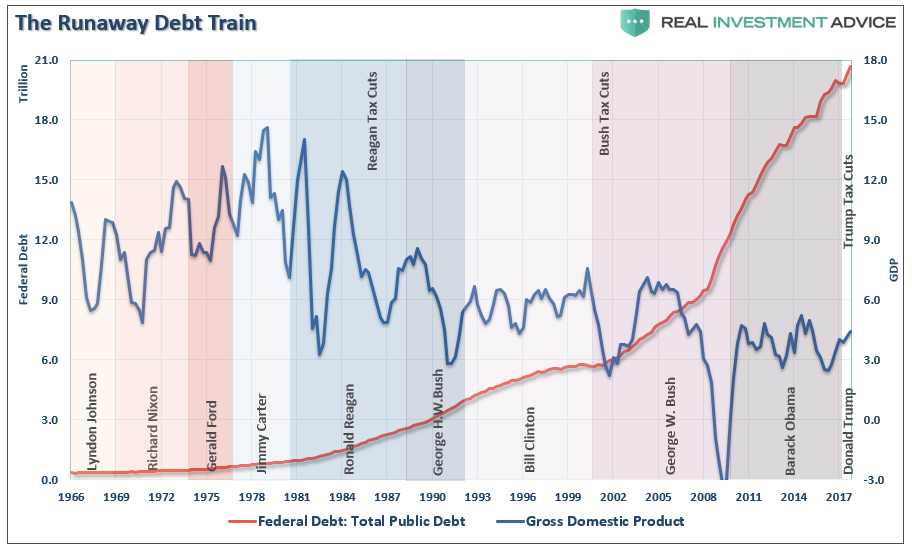
Trillion Dollar Deficits
The Committee For A Responsible Federal Budget just released the following analysis:
“The Congressional Budget Office (CBO) released its ten-year budget and economic outlook today, showing that recent legislation has made an already challenging fiscal situation much worse. CBO’s report projects that:
- The budget deficit will near one trillion dollars next year, after which permanent trillion-dollar deficits will emerge and continue indefinitely. Under current law, deficits will rise from $665 billion (3.5 percent of Gross Domestic Product) last year to $1.5 trillion (5.1 percent of GDP) by 2028.
- As a result of these deficits, debt held by the public will increase by more than $13 trillion over the next decade – from $15.5 trillion today to $28.7 trillion by 2028. Debt as a share of the economy will also rise rapidly, from today’s post-war record of 77 percent of GDP to above 96 percent of GDP by 2028.
- Cumulative deficits through 2027 are projected to be $1.6 trillion higher than CBO’s last baseline in June 2017. The entirety of this difference is the result of recent legislation, most significantly the 2017 tax law.
- Spending will increase significantly over the next decade, from 20.8 percent of GDP in 2017 to 23.6 percent by 2028. Revenue will dip from 17.3 percent of GDP in 2017 to 16.5 percent by 2019 before rising to 18.5 percent of GDP by 2028 as numerous temporary tax provisions expire.
- Deficits and debt would be far higher if Congress extends various temporary policies. Under CBO’s Alternative Fiscal Scenario, where Congress extends expiring tax cuts and continues discretionary spending at its current level, the deficit would eclipse $2.1 trillion in 2028, and debt would reach 105 percent of GDP that year – nearing the record previously set after World War II.
CBO’s latest projections show that recent legislation has made an already challenging fiscal situation much more dire. Under current law, trillion-dollar deficits will return soon and debt will be on course to exceed the size of the economy. Under the Alternative Fiscal Scenario, the country would see the emergence of $2 trillion deficits, and debt would reach an all-time record by 2029.”
This analysis certainly isn’t the policy prescription to “Make America Great Again,” but rather “Make America More Indebted.”
I encourage you to read the entire analysis by the CRFB, but the bottom line is what we already know, more debt equals less economic growth.
“As a result of this and other effects, CBO estimates real GDP growth of 1.5 to 1.8 percent each year after 2020, with an annual average of 1.8 percent over the 2018-2028 period. This is very similar to the average growth rate projected in June 2017.
Notably, CBO’s projected average growth rate is significantly lower than the roughly 3 percent assumed in the President’s FY 2019 budget. Such rapid levels of growth are far below what others – including the Federal Reserve – have projected; and they are highly unlikely to occur based on available economic evidence. The fact that 3 percent growth could be sustained for two years does not suggest it could be continued indefinitely over the long term.”
As I noted previously, it now requires $3.71 of debt to create $1 of economic growth which will only worsen as the debt continues to expand at the expense of stronger rates of growth.
CBO – Always Wrong
Furthermore, it is highly likely the CBO will be incorrect in their assumptions, as they almost always are, because there are many items the CBO is forced to exclude in its calculations.
First, the CBO’s governing statutes essentially require a distorted view of the finances by not allowing for an accounting of the tax breaks Congress routinely extends. As William Gale from the Tax Policy Institute explained:
“Here’s the bad part: Under current law, CBO projects that the debt – currently 77 percent as large as annual GDP – will rise to 96 percent of GDP by 2028. And that’s if Congress does nothing. If instead, Congress votes to extend expiring tax provisions – such as the many temporary tax cuts in the 2017 tax overhaul – and maintain spending levels enacted in the budget deal (which is called the “current policy” baseline), debt is projected to rise to 105 percent of GDP by 2028, the highest level ever except for one year during World War II (when it was 106 percent).”
So, once you understand what the CBO isn’t allowed to calculate or show, it is not surprising their predictions have consistently overstated reality over time. However, it’s how Congress wants the projections reported so they can continue to ignore their fiscal responsibilities.
This is a big problem which David Stockman, former head of Government Accountability Office, pointed out:
“What that leads to is a veritable fiscal nightmare. Whereas the CBO report already forecasts cumulative deficits of $12.5 trillion during the next decade, you’d get $20 trillion of cumulative deficits if you set aside Rosy Scenario and remove the crooked accounting from the CBO baseline.
In a word, what was a $20 trillion national debt when the Donald arrived in the White House is no longer. Now it’s barreling toward $40 trillion within the next decade.
We have no ideas how much economic carnage that will cause, but we are quite sure it will not make America Great Again.”
However, besides those flaws, the CBO gives no weight to the structural changes which will continue to plague economic growth going forward. The combination of fiscally irresponsible tax cuts combined with:
- Spending hikes
- Demographics
- Surging health care costs
- Structural employment shifts
- Technological innovations
- Globalization
- Financialization
- Global debt
These factors will continue to send the debt to GDP ratios to record levels. The debt, combined with these numerous challenges, will continue to weigh on economic growth, wages and standards of living into the foreseeable future. As a result, incremental tax and policy changes going forward will have a more muted effect on the economy as well.
Conclusion
The CBO’s latest budget projections confirm what we, and the CRFB, have been warning about. The current Administration has taken a path of fiscal irresponsibility which will take an already dismal fiscal situation and made it worse.
While the previous Administration was continually chastised by “conservative” Republicans for running trillion-dollar deficits, the Republicans have now decided trillion dollar deficits are acceptable.
That is simply hypocritical.
Given the flaws in the CBO’s calculations, their current projections of $1 trillion in deficits next year, and exceeding that mark every year after, will likely turn out to be overly optimistic. Even the CBO’s Alternative Fiscal Scenario of $2 trillion deficits over the next decade could turn out worse.
But William Gale summed up the entirety of the problem nicely.
“Here’s the worse part: The conventional comparison is misleading. The projected budget deficits in the coming decade are essentially ‘full-employment’ deficits. This is significant because, while budget deficits can be helpful in recessions by providing an economic stimulus, there are good reasons we should be retrenching during good economic times, including the one we are in now. In fact, CBO projects that, over the 2018-2028 period, actual and potential GDP will be equal.
As President Kennedy once said ‘the time to repair the roof is when the sun is shining.’ Instead, we are punching more holes in the fiscal roof.
In order to do an ‘apples to apples’ comparison, we should compare our projected Federal budget deficits to full employment deficits. From 1965-2017, full employment deficits averaged just 2.3 percent of GDP, far lower than either our current deficit or the ones projected for the future.
The fact that debt and deficits are rising under conditions of full employment suggests a deeper underlying fiscal problem.”
The CBO’s budget projections are a harsh reminder the fiscal largesse that Congress and the Administration lavished on the country in the recent legislation is not a free lunch.
It is just a function of time until the “bill comes due.”
