Get 40% Off
🤯 Perficient is up a mind-blowing 53%. Our ProPicks AI saw the buying opportunity in March.Read full update

Caterpillar Is Cratering

Published 06/11/2021, 02:33 PM
Updated 07/09/2023, 06:31 AM

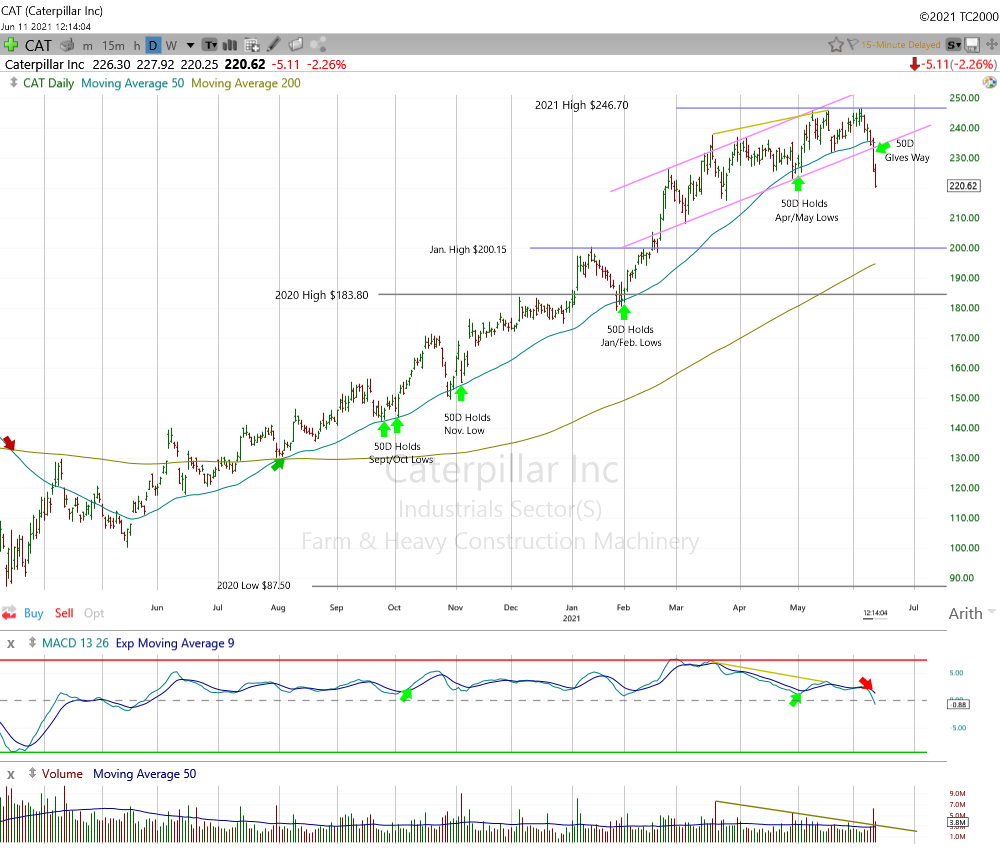
Caterpillar Daily Chart.

Caterpillar (NYSE:CAT) is under heavy pressure as the week comes to an end. On Thursday, shares fell 3.8% with the help of a big bump in volume. This damaging breakdown pierced a key trendline that had linked the March/April lows. The 50-day moving average, which has provided solid support since September, also gave way under this extreme selling pressure. CAT is off another 2.3% today as it dips below the April and May lows. This is quite a reversal of the action earlier this month when the stock put in a new high for the year.

We expect more downside in the near term. Initial support is near $200 (January high). The 200-day moving average, which has not been tested since the early August ‘Golden Cross,” is just below and is trending higher. A week from now the 200-day will be approximately $196.50.

Note: We have no position.

You can read Gary S. Morrow's original post here.

Latest comments

Steel prices are up 400% and shipping rates (got to that equipment to overseas buyers) are up 300%. all the while all CATS biggest customers for the last 40 years (like China) are now its COMPETITORs.Not to mention the worldwide Covid recession that we are STILL in... - The REAL question here is why isn't cat at $20 under these conditions? And BTW cat is a UNION company, with wages coming UP in this country, how are they going to compete with asian countries that still have $3hr workers and ROBOTICS to do more and more of the work? Just a few things to chew on for long term Cat bulls its 40 year hay day during China's growth days are over PERMANENTLY. CHINA is now a serious competitor and its NOT alone.
I’m predicting a 10% cumulative 3 day jump over MTW to $242
No real rationale given for a continued fall to 200. Given the beautiful algo institutional short curve today with a huge spike in volume and price near closing suggests short positions closing. Prob only open a day. Technicals are WAYoversold and fundamentals are bipartisan infrastructure 1.2 tril CAT cow.
anyone trading this market that actually believes that there is any such thing as WAY OVER SOLD, Has completely lost sight of what this market has done in the last 10 years, and the fact that on an 80 year chart the AVERAGE interest rate was 8.5% with highs at 22% the LAST TIME we hit runaway inflation that we are headed for now. this market is a total historical fluke and so is this economy. come ON man, since WHEN does the government GIVE MONEY AWAY to people who have plenty?? Suggestion, put your daily and weekly charts aside for a minute and take a gander that the MONTHLY AND YEARLY charts and tell me where WAY OVERSOLD on THOSE would be.... I'm not suggesting short YET, there is no such thing as way OVERBOUGHT either in this crazy market, im just saying we are living in SINGULAR times all rules are OUT. 0 percent interest rates??? who would have EVER believed that 20 years ago???
totally agree
Risk Disclosure: Trading in financial instruments and/or cryptocurrencies involves high risks including the risk of losing some, or all, of your investment amount, and may not be suitable for all investors. Prices of cryptocurrencies are extremely volatile and may be affected by external factors such as financial, regulatory or political events. Trading on margin increases the financial risks.
Before deciding to trade in financial instrument or cryptocurrencies you should be fully informed of the risks and costs associated with trading the financial markets, carefully consider your investment objectives, level of experience, and risk appetite, and seek professional advice where needed.
Fusion Media would like to remind you that the data contained in this website is not necessarily real-time nor accurate. The data and prices on the website are not necessarily provided by any market or exchange, but may be provided by market makers, and so prices may not be accurate and may differ from the actual price at any given market, meaning prices are indicative and not appropriate for trading purposes. Fusion Media and any provider of the data contained in this website will not accept liability for any loss or damage as a result of your trading, or your reliance on the information contained within this website.
It is prohibited to use, store, reproduce, display, modify, transmit or distribute the data contained in this website without the explicit prior written permission of Fusion Media and/or the data provider. All intellectual property rights are reserved by the providers and/or the exchange providing the data contained in this website.
Fusion Media may be compensated by the advertisers that appear on the website, based on your interaction with the advertisements or advertisers.
© 2007-2024 - Fusion Media Limited. All Rights Reserved.