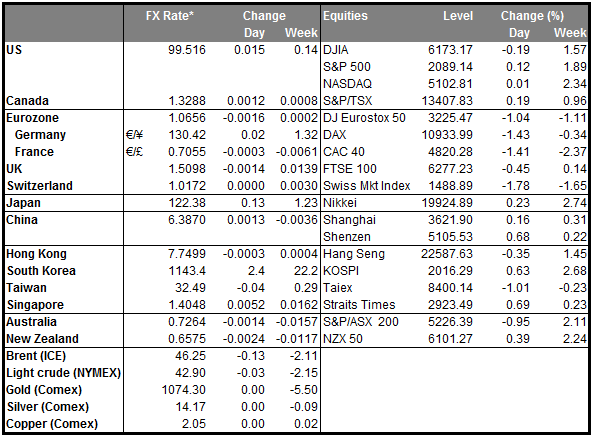
• Carney may be questioned on Brexit risks BoE Governor Carney will testify to parliament today on monetary policy and the outlook of the UK economy. Following the latest developments on the “Brexit” referendum, lawmakers are likely to question him on how the BoE will respond to market volatility ahead of the vote and to the scenario of a “Brexit”. The last time Carney spoke about the risks a Brexit poses, he emphasized the large size of Britain’s current account deficits and the possibility of a ‘risk premium’ being attached to UK assets because of the uncertainty surrounding the outcome. The Governor may try his best not to get dragged into the In/Out debate, but as the referendum date is sealed, lawmakers could back him into a corner in order to clarify the risks this poses to monetary policy. The tone of his comments could determine the pound’s reaction, which has been under increased selling pressure since London’s Mayor voiced his official support for the “Out” campaign. We expect that after this testimony, the pound’s direction will continue to be dictated by the results of incoming polls on the EU vote. The latest poll conducted after Friday’s deal, showed a slight preference to stay in the EU.
• As for the indicators today, during the European day, the German Ifo survey for February is forecast to show that all three indices continued to decline for the 3rd consecutive month. This would be in line with the ZEW survey for the same month, which showed that business confidence in Eurozone’s growth engine continued to be dragged down by a weaker global economy. This could add further selling pressure to the common currency and could be a cause for a break below the 1.1000 line. Germany’s final GDP for Q4 is already out and the figure confirmed the initial estimate.
• In the US, existing home sales for January are expected to have fallen somewhat in January, after rising sharply in December. Given the sharp increase in December, a modest decline in January appears more than normal to us. After all, the housing sector held strong in Q4 2015, despite the sharp deceleration in economic growth during the quarter. Therefore, we believe that any negative impact on USD from a possible decline in existing home sales is likely to be short lived. The SnP/Case-Shiller house price index for December is also coming out. The Conference Board consumer confidence index for February is expected to have declined from the previous month. This would be in line with the slide in the preliminary U of M consumer sentiment for the same month. However, we believe that consumer confidence remains at healthy levels albeit the recent global uncertainty and the collapse in equity markets worldwide. This was evident in the strong retail sales print for January, while January’s personal spending due to be out on Friday is expected to show a similar gain. Here as well we will treat any possible setbacks in USD as corrective moves of its recent recovery.
• Besides BoE Governor Mark Carney, we have four more speakers during the day: Fed Vice-Chairman Stanley Fischer, Minneapolis Fed President Neel Kashkari, SNB Governor Thomas Jordan and Riksbank Governor Stefan Ingves.
The Market
EUR/USD plunges and hits 1.1000
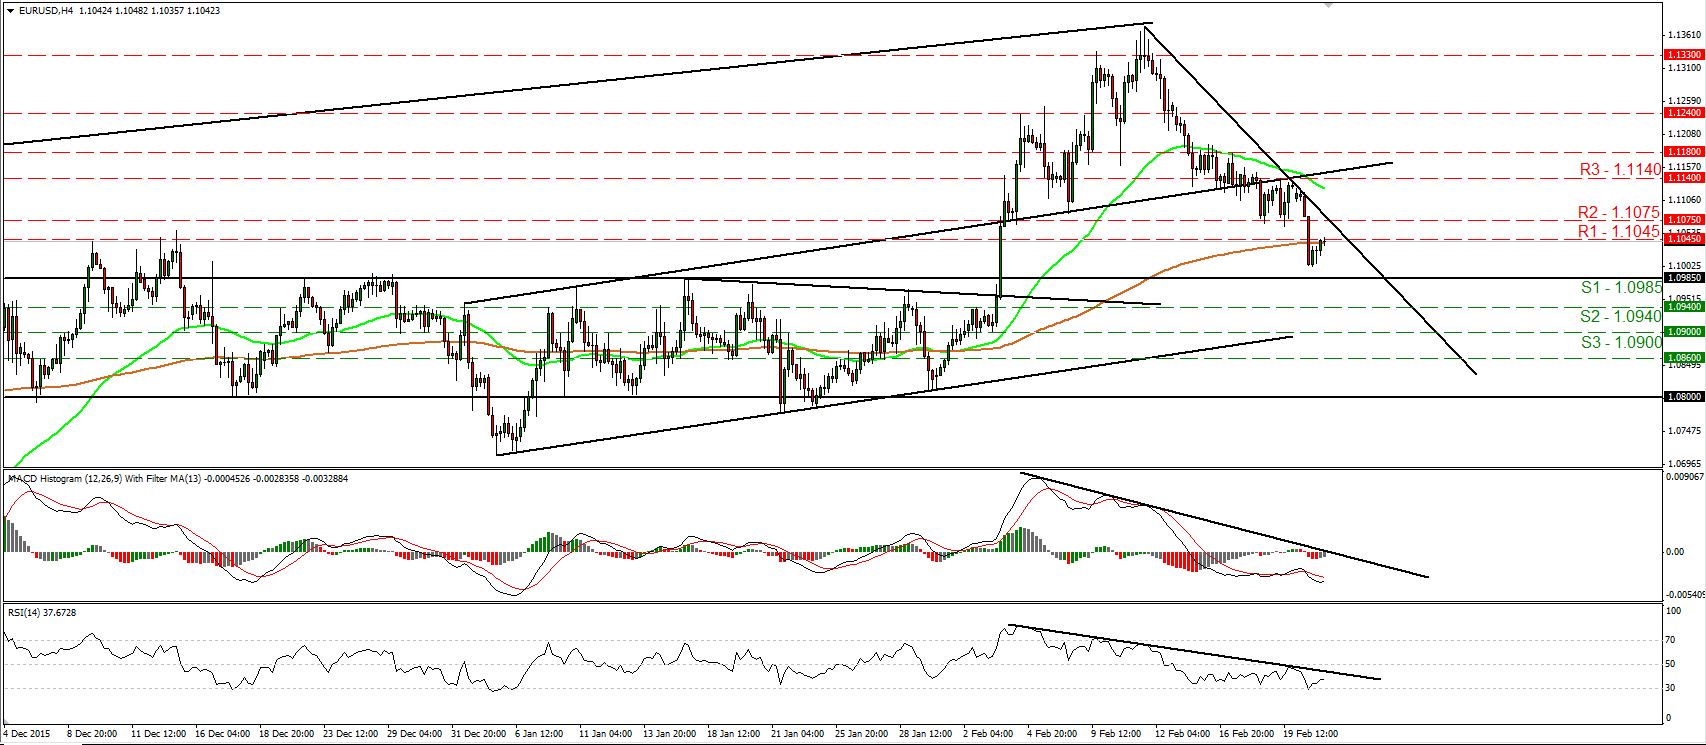
• EUR/USD collapsed yesterday falling below two support (now turned into resistance) barriers in a row. Nevertheless, the decline was stopped by the 1.1000 level, slightly above the 1.0985 (S1) area, which is the upper bound of the sideway range the pair had been trading from the 3rd of December until the 3rd of February. Subsequently the rate rebounded somewhat. Having in mind that the rate is trading below the short-term downtrend line taken from the peak of the 11th of February, I would consider the short-term outlook to be negative. However, taking a look at our short-term oscillators, I see signs that the current corrective bounce may continue for a while before sellers decide to take control again, perhaps to test the 1.1075 (R2) barrier as a resistance this time. The RSI rebounded from its 30 line, while the MACD shows signs of bottoming and could move above its trigger line soon. As for the broader trend, as long as EUR/USD is trading between the 1.0800 key zone and the psychological area of 1.1500, I would keep the view that the broader trend remains sideways.
• Support: 1.0985 (S1), 1.0940 (S2), 1.0900 (S3)
• Resistance: 1.1045 (R1), 1.1075 (R2), 1.1140 (R3)
GBP/JPY continues its downtrend
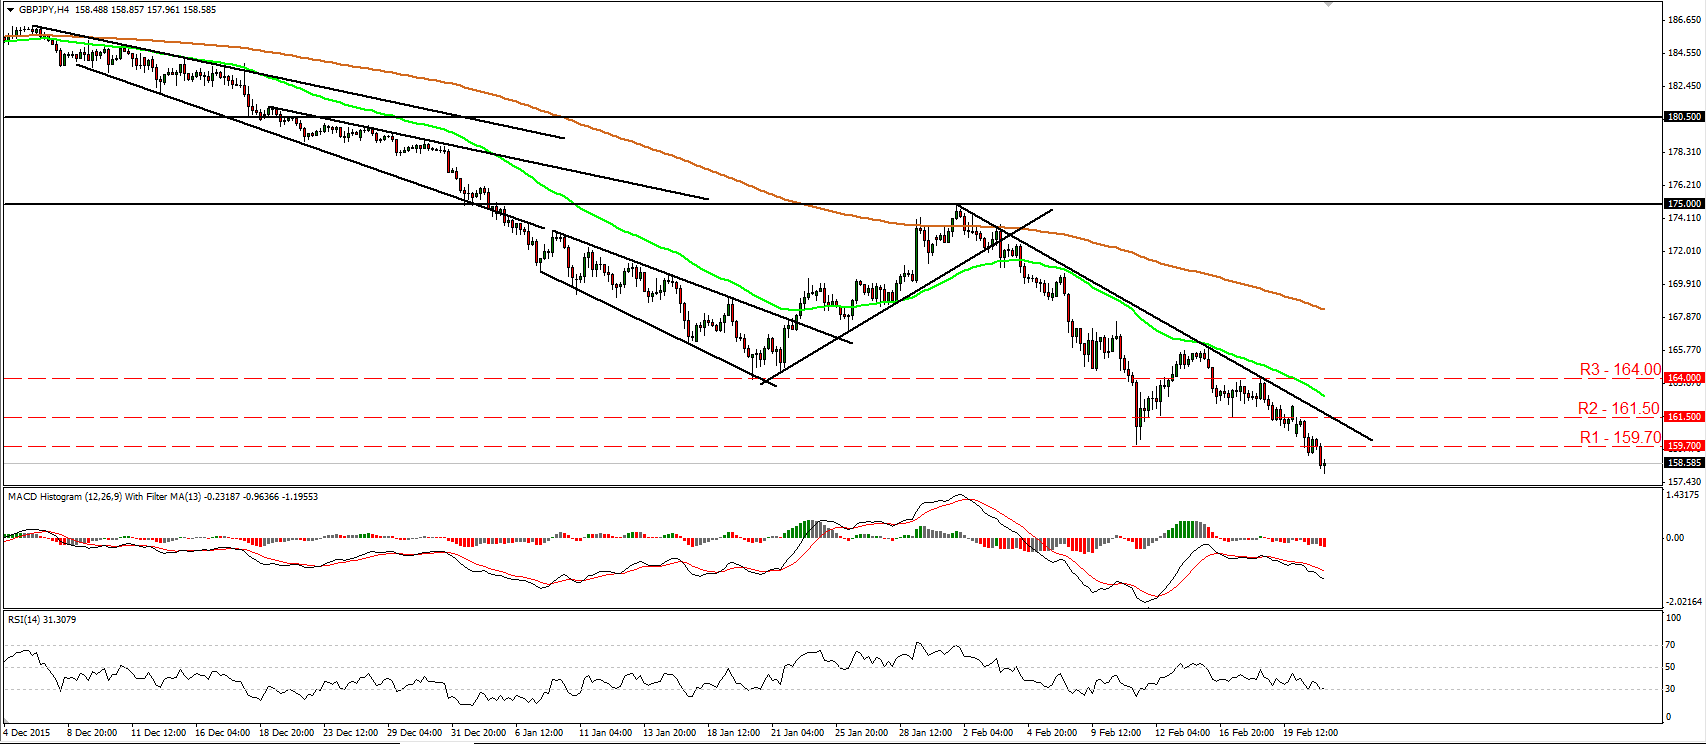
• GBP/JPY continued sliding on Monday, falling below the support (now turned into resistance) barrier of 159.70 (R1). The move confirmed a forthcoming lower low, something that keeps the bias to the downside. I would now expect the bears to aim for the support area of 156.60 (S1), marked by the lows of the 29th of October and 5th of November 2013. Our short-term oscillators detect accelerating downside speed and amplify the case for the pair to continue falling. The RSI edged down and now appears ready to break below its 30 line, while the MACD, stands below both its zero and trigger lines, and points south. Zooming out to the daily chart, I see that the pair started collapsing again following a test at the psychological zone of 175.00. This confirms that the 20th of January – 1st of February recovery was just a corrective phase and that the longer-term outlook remains negative as well.
• Support: 156.60 (S1), 154.75 (S2), 150.70 (S3)
• Resistance: 159.70 (R1), 161.50 (R2), 164.00 (R3)
AUD/USD surges and hits 0.7240
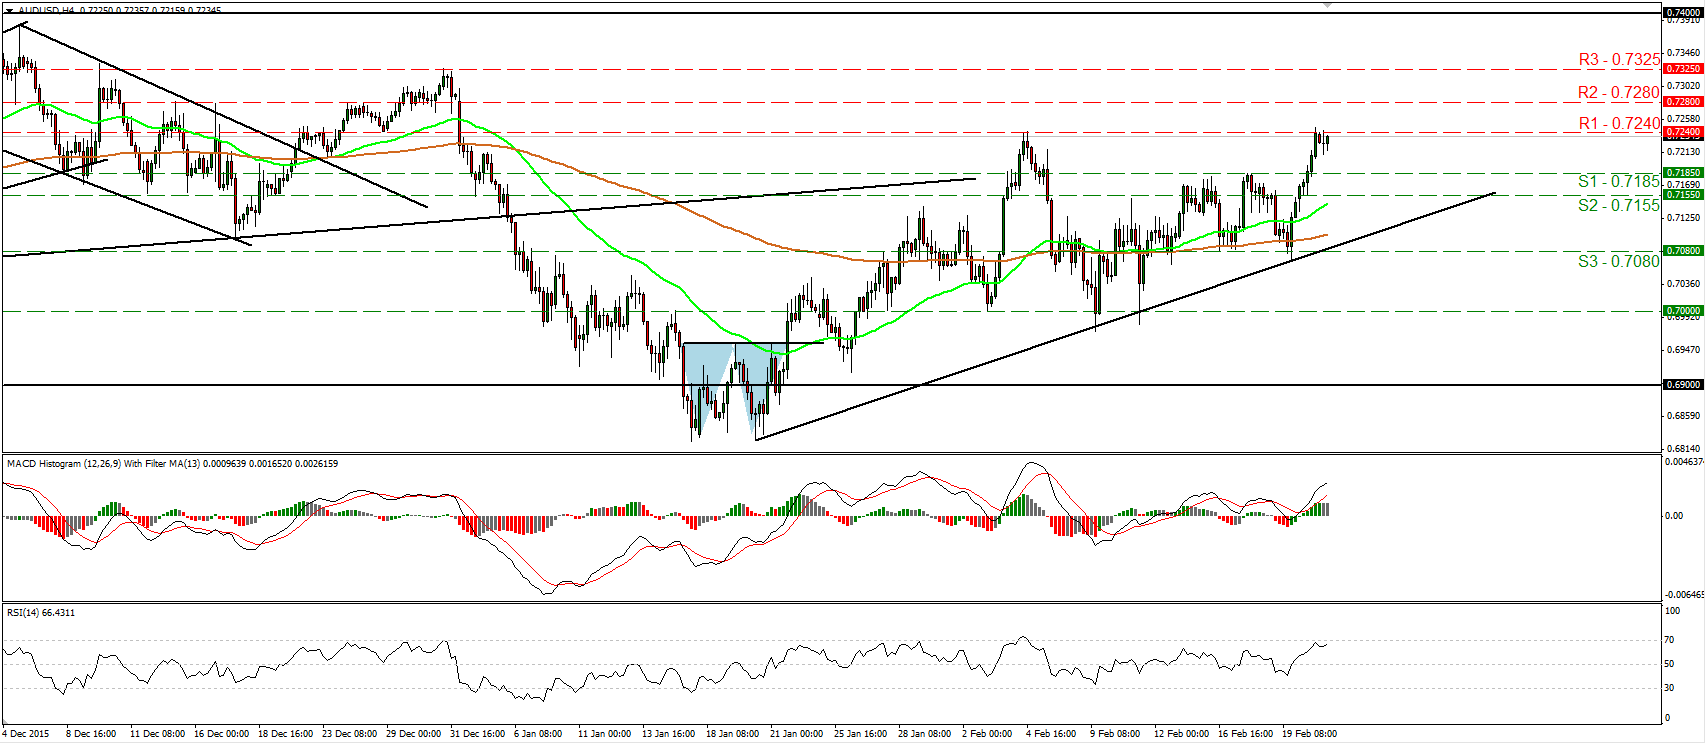
• AUD/USD surged on Monday, breaking above the resistance (now turned into support) hurdle of 0.7185 (S1). Nonetheless, the advance was halted by the 0.7240 (R1) resistance obstacle, marked by the peak of the 4th of February. Given that the pair remains above the uptrend line drawn from the low of the 20th of January, I would consider the near-term outlook to stay positive. I would expect a decisive break above 0.7240 (R1) to open t eh way for our next obstacle of 0.7280 (R2). Taking a look at our short-term momentum studies, I see that the RSI moved higher and could move above 70 soon, while the MACD stands above both its zero and trigger lines, pointing up. These indicators reveal positive momentum and support the case for further advances. As for the bigger picture, given that the rate is trading within the sideways range between 0.6900 and 0.7400, I would hold a “wait and see” stance as far as the longer-term bias is concerned.
• Support: 0.7185 (S1), 0.7155 (S2), 0.7080 (S3)
• Resistance: 0.7240 (R1), 0.7280 (R2), 0.7325 (R3)
Gold appears to be trading within a triangle
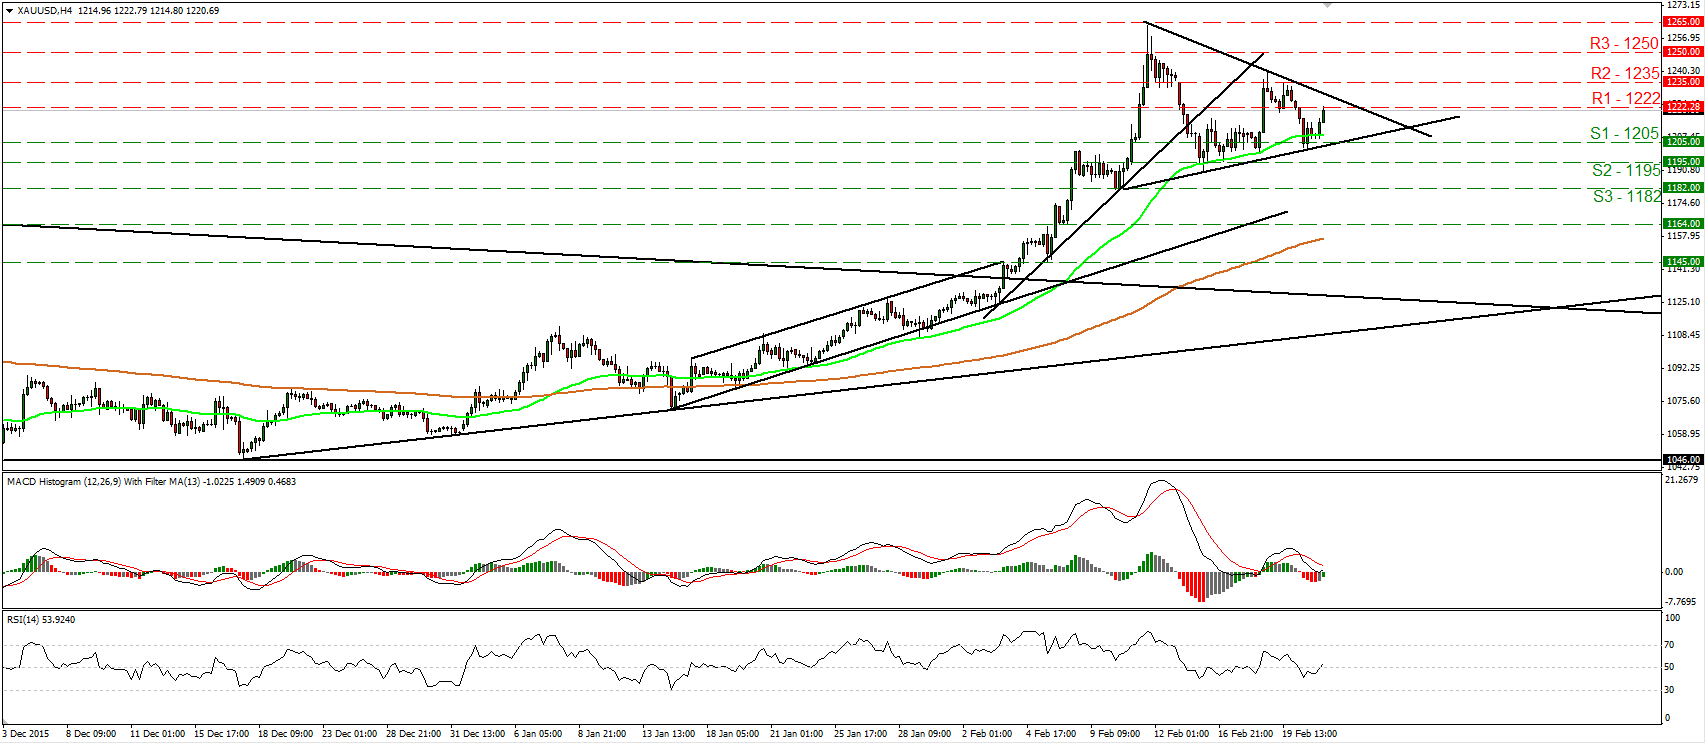
• Gold traded lower on Monday, but during the Asian morning Tuesday, it hit support near 1205 (S1) and then it rebounded. The metal seems to be trading within a triangle formation since the 11th of February and therefore, I would switch my view to neutral as far as the short-term outlook is concerned. A break above the upper bound of the triangle and the 1235 (R2) obstacle is needed in my opinion to signal the resumption of the prevailing uptrend. Something like that could initially aim for our next resistance at 1250 (R3). Switching to the daily chart, I see that on the 4th of February, the price broke above the long-term downside resistance line taken from the peak of the 22nd of January 2015. As a result, I would consider the medium-term outlook to be cautiously positive. I would treat the aforementioned triangle as a brief pause for now.
• Support: 1205 (S1), 1195 (S2), 1182 (S3)
• Resistance: 1222 (R1), 1235 (R2), 1250 (R3)
WTI hits resistance at 32.00
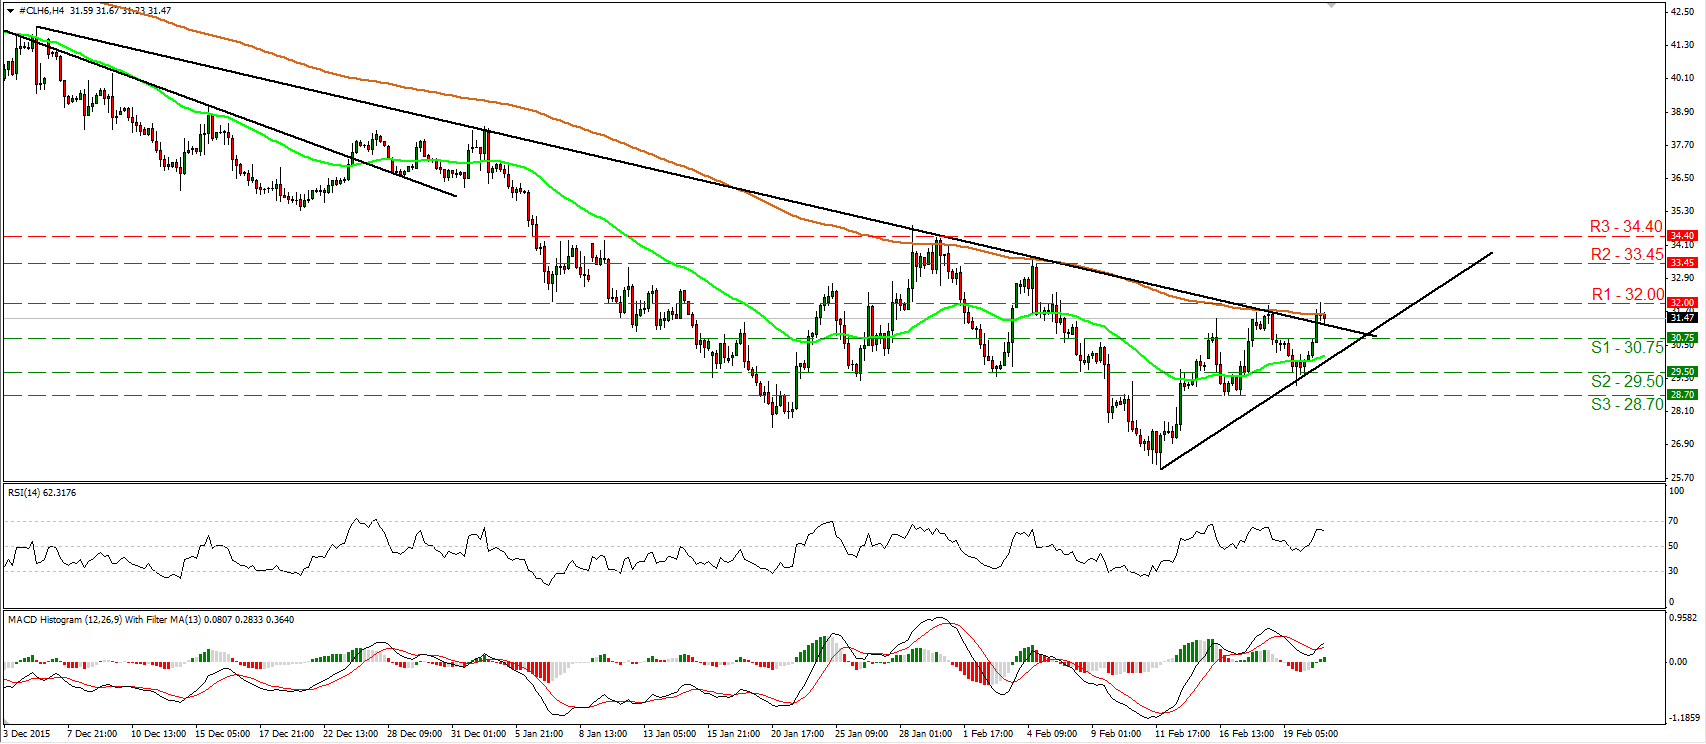
• WTI edged higher on Monday, breaking above the downtrend line taken from the peak of the 4th of December. However, the move was stopped by the 32.00 (R1) barrier, defined by the peak of the 18th of February. A break above that resistance could confirm that the near-term bias has changed to the upside and could see scope for extensions towards the next hurdle of 33.45 (R2), marked by the high of the 4th of February. Our short-term oscillators support somewhat the notion. The RSI rebounded from slightly below its 50 line, while the MACD, already positive, has bottomed and crossed above its trigger line. On the daily chart, I see that WTI has been printing lower peaks and lower troughs since the 9th of October, which keeps the longer-term picture negative. However, I see positive divergence between both our daily oscillators and the price action, something that increases the possibilities for WTI to continue correcting higher.
• Support: 30.75 (S1), 29.50 (S2), 28.70 (S3)
• Resistance: 32.00 (R1), 33.45 (R2), 34.40 (R3)


