
CarMax Inc. (NYSE:KMX) posted net earnings per share of $1.13 in fourth-quarter fiscal 2019 (ended Feb 28, 2019), up 68.7% from 67 cents in the year-ago period. Moreover, earnings surpassed the Zacks Consensus Estimate of $1.04 per share. The company’s net earnings increased 57.6% year over year to $192.6 million.
Moreover, net sales and operating revenues in the reported quarter increased 5.7% year over year to $4.32 billion. However, the figure missed the Zacks Consensus Estimate of $4.39 billion. Total gross profit rose 11.7% year over year to $599.4 million.
During fourth-quarter fiscal 2019, CarMax’s used-vehicle sales rose 5.8% from the prior-year period to $3.6 billion as unit sales increased 5.6% to 180,207 vehicles. The average selling price of used vehicles rose 0.3% from the year-ago quarter to $19,978. Comparable store used-vehicle unit sales rose 2.8% from the prior-year level. The improved performance reflects improved conversion, partially offset by lower store traffic.
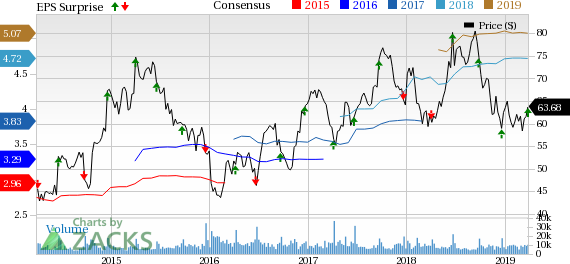
CarMax, Inc. Price, Consensus and EPS Surprise
Wholesale vehicle revenues rose 3.1% from a year ago to $543.8 million in the reported quarter. Unit sales increased 3.7% year over year to 102,887 vehicles, courtesy of growth in store base. The average selling price of wholesale vehicles declined 1% from the prior-year quarter to $5,024.
Other sales and revenues increased 14.6% year over year. Moreover, the extended protection plan’s (EPP) revenues rose 19.9% from the year-ago level.
CarMax Auto Finance (“CAF”) reported a year-over-year increase of 2.6% in income to $103.7 million in the quarter under review, reflecting collective effects of a 7.8% rise in average managed receivables and a slightly lower total interest margin percentage.
Fiscal 2019 Results
In the fiscal year, the company’s net earnings increased 33.1% year over year to $4.79 per share.
The company’s net sales and operating revenues improved 6.1% to $18.2 billion from the year-ago figure of $17.1 billion.
Store Openings
During fourth-quarter fiscal 2019, CarMax opened five stores, which included three stores in new television markets, namely Buffalo, NY; Montgomery, AL; and New Orleans, LA. During the fiscal year, it opened 15 stores that led to a total store count of 203 used car stores as of Feb 28, 2019.
Share Repurchase Program
In the quarter under review, CarMax spent $270.1 million to repurchase 4.4 million shares under the existing share buyback program. During the fiscal year, it repurchased 13.6 million shares of common stock for $902.9 million. As of Feb 28, 2019, the company had $2.11 billion of authorization remaining under its share repurchase program.
Financial Position
CarMax had cash and cash equivalents of $47 million as of Feb 28, 2019, up from $44.5 million in the corresponding period of 2018. Long-term debt (excluding current position) amounted to $1.2 billion as of Feb 28, 2019, reflecting an increase from $995 million in the comparable year-ago period.
Plans for Fiscal 2020
CarMax plans to open 13 stores in fiscal 2020 and 2021 each. Further, it projects $350 million capital expenditure in fiscal 2020 owing to change in spending plans and the addition of three customer experience centers to support omni-channel roll-out.
Zacks Rank & Stocks to Consider
CarMax currently carries a Zacks Rank #3 (Hold). Some better-ranked stocks in the broader auto sector are Fox Factory Holdings Corporation (NASDAQ:FOXF) , Oshkosh Corporation (NYSE:OSK) and General Motors Company (NYSE:GM) , each carrying a Zacks Rank #2 (Buy). You can see the complete list of today’s Zacks #1 Rank (Strong Buy) stocks here.
Fox Factory has an expected long-term growth rate of 15.1%. Over the past three months, shares of the company have gained 18.3%.
Oshkosh’s long-term growth rate is projected at 11.3%. Shares of the company have gained 20.3% over the past three months.
General Motors has an expected long-term growth rate of 8.9%. Shares of the company have gained 10.8% over the past three months.
Today's Best Stocks from Zacks
Would you like to see the updated picks from our best market-beating strategies? From 2017 through 2018, while the S&P 500 gained +15.8%, five of our screens returned +38.0%, +61.3%, +61.6%, +68.1%, and +98.3%.
This outperformance has not just been a recent phenomenon. From 2000 – 2018, while the S&P averaged +4.8% per year, our top strategies averaged up to +56.2% per year.
See their latest picks free >>
CarMax, Inc. (KMX): Free Stock Analysis Report
Fox Factory Holding Corp. (FOXF): Free Stock Analysis Report
General Motors Company (GM): Free Stock Analysis Report
Oshkosh Corporation (OSK): Free Stock Analysis Report
Original post
Zacks Investment Research