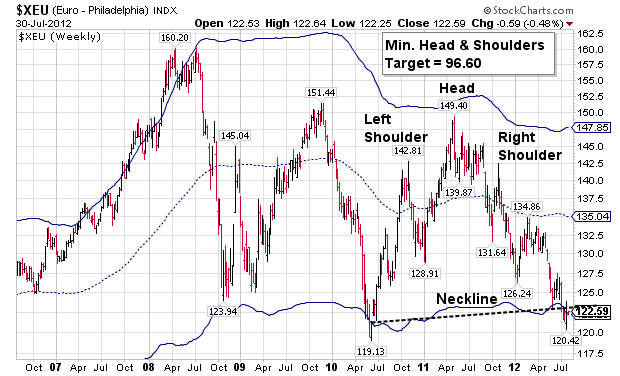
Forget the spin! There is no disputing that the euro is in big trouble. How much trouble may be defined technically with the Head and Shoulders pattern illustrated in the chart below that has just been triggered. This pattern projects a minimum target of 96.60, meaning the euro may drop below parity…possibly in the next two months. The trading bands offer parameters for the major cycle highs and lows. In the last two weeks the lower trading band has not given any support to the euro. Should it continue its failure pattern, the situation may be very bearish, indeed.
For those not acquainted with the Head and Shoulders pattern, it is a highly recognizable reversal formation with a 93% reliability factor, which makes this pattern very popular with traders. The normal pattern contains three peaks, with the center peak (head) being higher than the right or left peaks, which are called “shoulders.” In this case, there are five peaks, but the added complexity in no way reduces its reliability. (Source: Encyclopedia of Chart Patterns, by Thomas N. Bulkowski, Page 290)
The euro is the poster child for what we call the “Liquidity Cycle.” The reason why we gave it this name is because it refers to the increasing inability to prolong the debt financing/refinancing that is needed to prop up the respective economies in the eurozone. Suffice it to say that, as the perceived risk of lending money to the eurozone rises, interest rates also rise, causing liquidity to dry up. Thus, the Liquidity Cycle was born when the PIIGS countries began to default on their loans. 
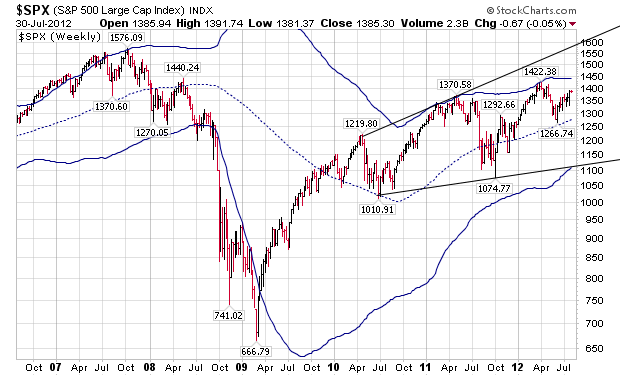
The S&P500 Index has been on a steadily-rising pattern since March 2009. That is, until April 2 this year when it peaked. The most recent rally has failed to overcome that high and may be poised for a change in trend. What may be happening is that the S&P 500 Index may have been “captured” by the Liquidity Cycle, and here’s why:
The euro and the S&P 500 Index began sharing cycle tops and bottoms starting on May 2, 2011, when both indices peaked on the same day. The next shared interval was on October 4, 2011, when both indices shared an identical bottom. The euro peaked early this year on February 23, but made a secondary high on March 30, just a weekend away from the April 2 peak in the S&P. Finally, both indices made a low on June 4, 2012. Since cycles are measured from low to low, it appears that the indices are now on identical cycles.
In summary, should the euro fail, there is a better than 50% probability that the S&P Index will decline, too. The S&P 500 Index bears a Broadening Wedge formation with a failed final peak, which strengthens the probability of a decline. While it is not activated yet, if the S&P 500 Index should fall below 1100, the average target for the Broadening Wedge is 880.00. While this is a lesser known formation, it has a 94% reliability rate. (Source: Encyclopedia Of Chart Patterns, by Thomas N. Bulkowski, page 72).
- English (UK)
- English (India)
- English (Canada)
- English (Australia)
- English (South Africa)
- English (Philippines)
- English (Nigeria)
- Deutsch
- Español (España)
- Español (México)
- Français
- Italiano
- Nederlands
- Português (Portugal)
- Polski
- Português (Brasil)
- Русский
- Türkçe
- العربية
- Ελληνικά
- Svenska
- Suomi
- עברית
- 日本語
- 한국어
- 简体中文
- 繁體中文
- Bahasa Indonesia
- Bahasa Melayu
- ไทย
- Tiếng Việt
- हिंदी
Captured By The Liquidity Cycle
Published 08/01/2012, 03:11 AM
Updated 07/09/2023, 06:31 AM
Captured By The Liquidity Cycle
3rd party Ad. Not an offer or recommendation by Investing.com. See disclosure here or
remove ads
.
Latest comments
Thank You very much indeed.
Install Our App
Risk Disclosure: Trading in financial instruments and/or cryptocurrencies involves high risks including the risk of losing some, or all, of your investment amount, and may not be suitable for all investors. Prices of cryptocurrencies are extremely volatile and may be affected by external factors such as financial, regulatory or political events. Trading on margin increases the financial risks.
Before deciding to trade in financial instrument or cryptocurrencies you should be fully informed of the risks and costs associated with trading the financial markets, carefully consider your investment objectives, level of experience, and risk appetite, and seek professional advice where needed.
Fusion Media would like to remind you that the data contained in this website is not necessarily real-time nor accurate. The data and prices on the website are not necessarily provided by any market or exchange, but may be provided by market makers, and so prices may not be accurate and may differ from the actual price at any given market, meaning prices are indicative and not appropriate for trading purposes. Fusion Media and any provider of the data contained in this website will not accept liability for any loss or damage as a result of your trading, or your reliance on the information contained within this website.
It is prohibited to use, store, reproduce, display, modify, transmit or distribute the data contained in this website without the explicit prior written permission of Fusion Media and/or the data provider. All intellectual property rights are reserved by the providers and/or the exchange providing the data contained in this website.
Fusion Media may be compensated by the advertisers that appear on the website, based on your interaction with the advertisements or advertisers.
© 2007-2024 - Fusion Media Limited. All Rights Reserved.
