Canadian Solar Inc. (CSIQ) designs, develops, manufactures and sells solar cell and solar module products that convert sunlight into electricity for a variety of uses. The Company conducts all of its manufacturing operations in China.
This is an order flow note along with some interesting vol. First, the news:
"Solar stocks are surging this morning after the first two Q4 reports (SPWR reported, STP preannounced) were better than expected (feared). " -- Source: Provided by Briefing.com
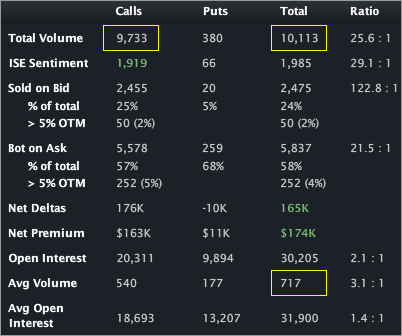
So, this is an industry wide phenomenon. I've decided to look at a smaller player. CSIQ has traded over 10,000 contracts on total daily average option volume of just 717. Calls have traded on a 25.6:1 ratio to puts. The action is in the Mar 4 calls. The Stats Tab and Day's biggest trades snapshots are included (below).

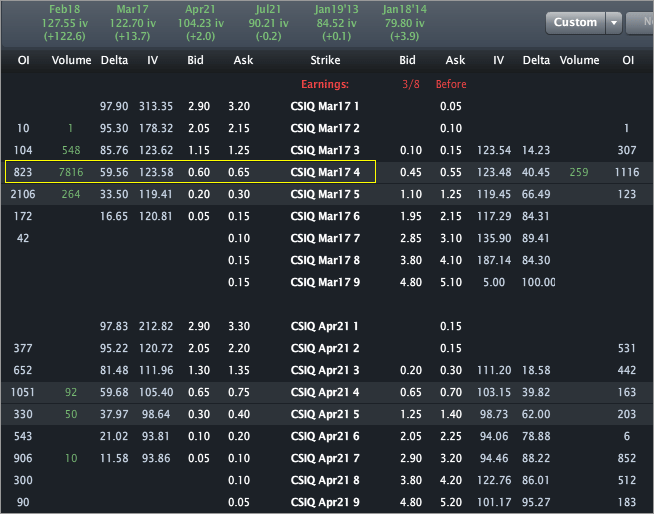
The Options Tab (below) illustrates that the calls are mostly opening (compare OI to trade size). Based on the orders and the vol move, these feel like substantially purchases, though there is some ambiguity. When looking down the entire option chain for CSIQ, I don't see any OI larger than 3,200, and that's in the Feb options expiring today. In other words, this flow is quite large for CSIQ.
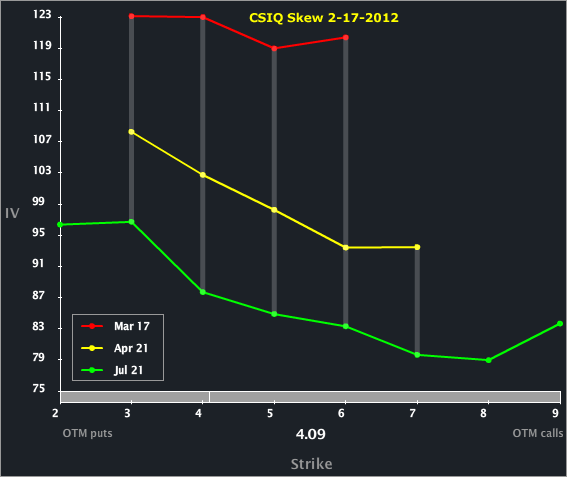
The Skew Tab snap (below) illustrates the vols by strike by month.
We can see a monotonic increase in vol from the back to the front. We project CSIQ will have earnings in the Mar expiry cycle, so that elevated vol is reflecting not just the news today, but also the news "to come."
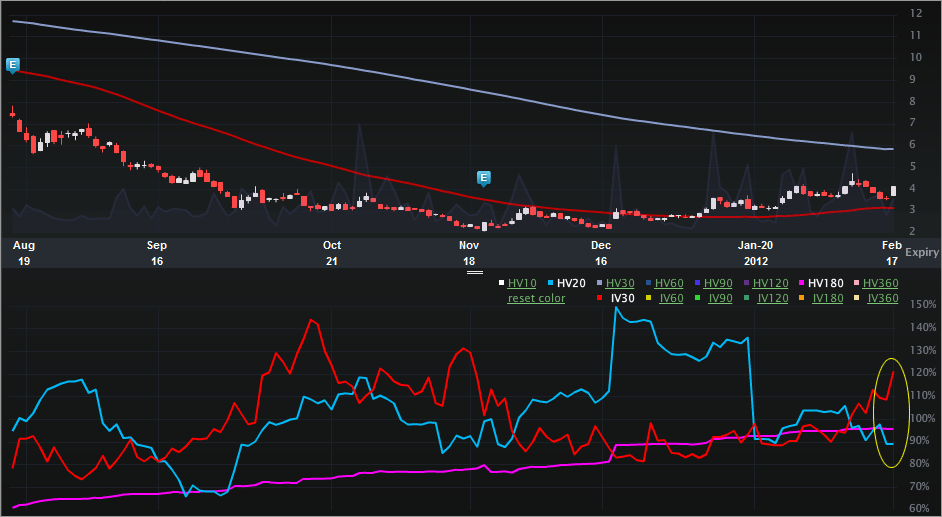
Finally, the Charts Tab (6 months) is below. The top portion is the stock price, the bottom is the vol (IV30™ - red vs HV20™ - blue vs HV180™ - pink). 
Here's where it gets interesting. CSIQ was trading $7.87 in the middle of August. It hit as low as $2.07 in the Fall. Now it's trading nearly double that price. On the vol side, the IV30™ peeked at over 144% in Oct, then dropped to ~90% as recently as 2-6-2012. Since then it's followed essentially straight line up to over 120%. Given the recent move in the underlying and with earnings approaching, it wouldn't surprise me if the IV30™ pushed through the annual high by early Mar.
This is trade analysis, not a recommendation.
- English (UK)
- English (India)
- English (Canada)
- English (Australia)
- English (South Africa)
- English (Philippines)
- English (Nigeria)
- Deutsch
- Español (España)
- Español (México)
- Français
- Italiano
- Nederlands
- Português (Portugal)
- Polski
- Português (Brasil)
- Русский
- Türkçe
- العربية
- Ελληνικά
- Svenska
- Suomi
- עברית
- 日本語
- 한국어
- 简体中文
- 繁體中文
- Bahasa Indonesia
- Bahasa Melayu
- ไทย
- Tiếng Việt
- हिंदी
Canadian Solar: Stock Rises on Industry News; Vol Continues to Climb Into Earnings
Published 02/19/2012, 12:52 AM
Updated 07/09/2023, 06:31 AM
Canadian Solar: Stock Rises on Industry News; Vol Continues to Climb Into Earnings
Latest comments
Loading next article…
Install Our App
Risk Disclosure: Trading in financial instruments and/or cryptocurrencies involves high risks including the risk of losing some, or all, of your investment amount, and may not be suitable for all investors. Prices of cryptocurrencies are extremely volatile and may be affected by external factors such as financial, regulatory or political events. Trading on margin increases the financial risks.
Before deciding to trade in financial instrument or cryptocurrencies you should be fully informed of the risks and costs associated with trading the financial markets, carefully consider your investment objectives, level of experience, and risk appetite, and seek professional advice where needed.
Fusion Media would like to remind you that the data contained in this website is not necessarily real-time nor accurate. The data and prices on the website are not necessarily provided by any market or exchange, but may be provided by market makers, and so prices may not be accurate and may differ from the actual price at any given market, meaning prices are indicative and not appropriate for trading purposes. Fusion Media and any provider of the data contained in this website will not accept liability for any loss or damage as a result of your trading, or your reliance on the information contained within this website.
It is prohibited to use, store, reproduce, display, modify, transmit or distribute the data contained in this website without the explicit prior written permission of Fusion Media and/or the data provider. All intellectual property rights are reserved by the providers and/or the exchange providing the data contained in this website.
Fusion Media may be compensated by the advertisers that appear on the website, based on your interaction with the advertisements or advertisers.
© 2007-2024 - Fusion Media Limited. All Rights Reserved.
