The markets were trading mixed with the US Dollar managing to hold firm by market close. The markets were influenced by headline reports about China imposing a new round of tariffs of $16 billion.
Reports about the ongoing tussle between the U.S. and the sanctions imposed on Iran continued. The U.S. was also seen preparing for a fresh round of sanctions on Russia with speculation that it could also hit the crude oil market.
Economic data was clearly dominated by the broader themes in the market. The U.S. Producer Price Index for July showed a flat print for the month. Core PPI rose just 0.1% on the month, falling below estimates of a 0.2% increase.
Earlier today, Japan released its preliminary first-quarter GDP report. Data showed that Japan's economy grew 0.4% on the quarter. This brought the annual GDP growth rate to 1.9%.
Later in the day, the UK's Office for National Statistics will be releasing the preliminary GDP report for the second quarter. Economists forecast that the UK's economic output doubled, rising 0.4% on the quarter. Later, the Manufacturing and Industrial Production alongside Construction Output reports will be coming out.
A busy afternoon will see the release of Canada's employment change for the month while the U.S. will be releasing its inflation numbers for July.
EUR/USD Intraday Technical Analysis

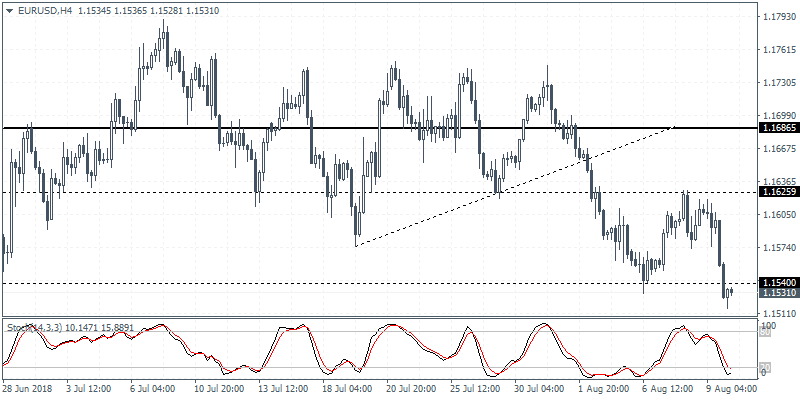
EURUSD (1.1531): The Euro currency was seen losing to the U.S. Dollar as the sideways range continues its grip. The EURUSD was seen erasing most of the gains logged from Tuesday and Wednesday. The declines coincided as price action briefly touched the short term resistance level at 1.1626. A new short-term range between 1.1626 and 1.1540 is being established. With the failure to make any progress beyond 1.1730 resistance level, the Common Currency is at risk of a potential downside breakout below 1.1540.
USD/JPY IntradayTechnical Analysis

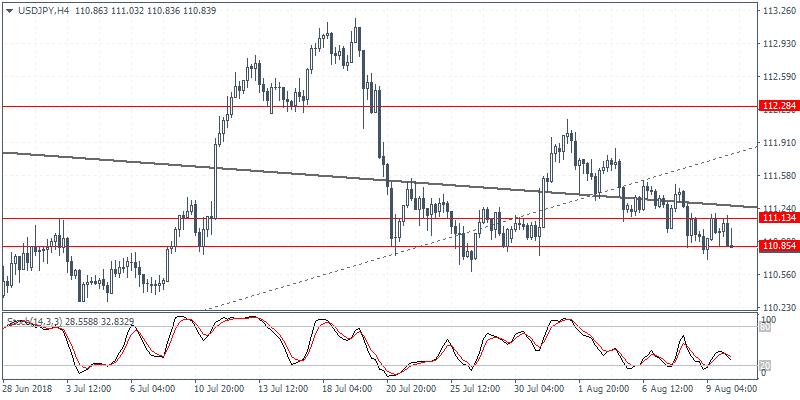
USD/JPY (110.83): The U.S. Dollar continued to extend gradual declines against the Japanese Yen. However, price action remains very sluggish. On the 4-hour chart, the currency pair was seen finding comfortable support near the 111.13 - 110.85 region. Consolidation continues within this area of support as a potential upside breakout could emerge. However, in the unlikely event that the support level is broken, USDJPY could be seen extending declines at a faster pace. Price action was seen testing the 50-day EMA which has managed to offer dynamic support.
XAU/USD IntradayTechnical Analysis

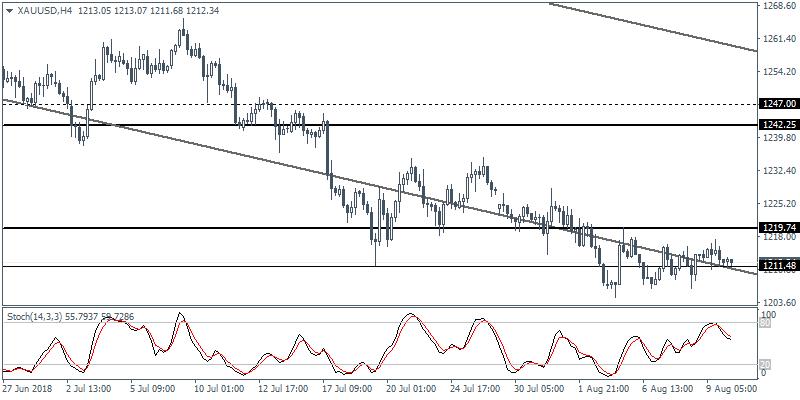
XAU/USD (1212.34): Gold prices have settled into a tighter rage, for the most part, this week. The sideways price action is expected to continue until a clear breakout emerges. With prices stalling near previous lows of 1204, the bias remains mixed. Gold is seen trading within the 1219 and 1211 range for the moment. Any retracement off the current lows could see a medium-term correction toward 1267 level which will mark a 38.2% retracement.
