Under Armour Inc (N:UA) Consumer Discretionary - Textiles, Apparel and Luxury Goods| Reports January 28, Before Markets Open
Key Takeaways
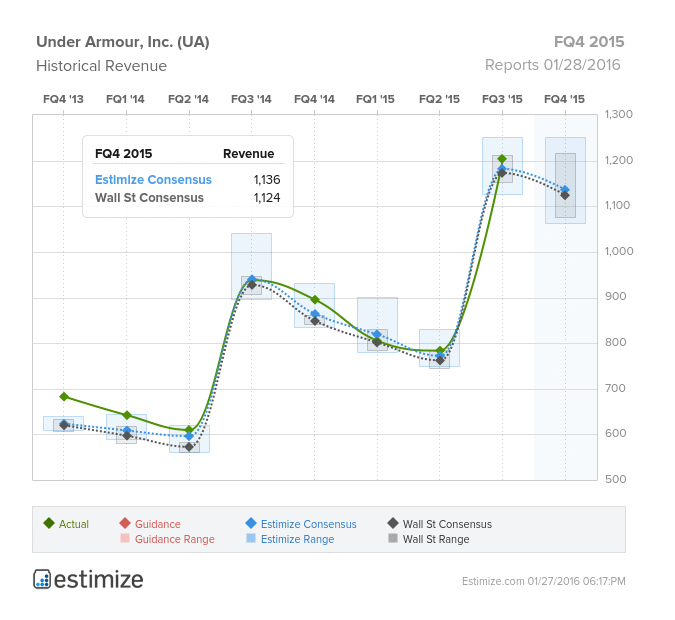
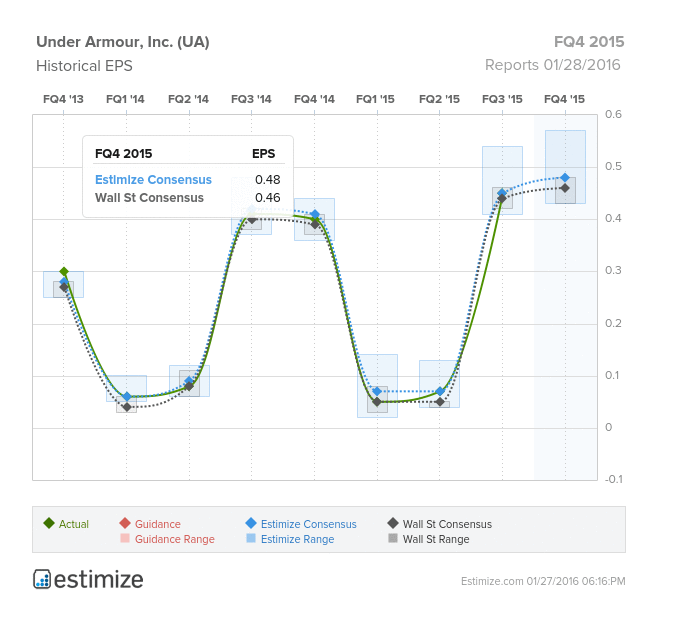
- The Estimize consensus calls for EPS of $0.48 and revenue of $1.136 billion, slightly higher than Wall Street’s estimates
- An unreasonably warm winter has caused an inventory hangover and slowdown in sales
- Under Armour is expected to rebound from a rough Q4 2015 with new product offerings, continued global expansion and improving direct to consumer initiatives
Once thought of as a viable threat to Nike’s dominance, Under Armour has fallen victim to a recent rough patch. Unseasonably warm weather has affected sales of items such as coats and winter hats. On the heels of a poor holiday season, shares of Under Armour plunged 25% in the past three months. In a competitive footwear and apparel industry, Under Armour has positioned itself as a premium brand against Nike (N:NKE) and lululemon athletica inc (O:LULU). Typically, the fourth quarter is peak season for retailers, however accumulating inventory and decelerating demand for Under Armour’s key products is expected to put a damper on Q4 earnings. The Estimize consensus calls for EPS of $0.48 and revenue of $1.136 billion when Under Armour reports Q4 earnings January 28th. Compared to Q4 2014, this represents a projected YoY growth in EPS and revenue of 20% and 27%, respectively. Despite strong YoY growth, Under Armour is expected to post a 6% decline in revenue from Q3 2015. On the bright side, Under Armour will benefit from the fast growing athletic footwear industry, new product offerings, a strong portfolio of athlete endorsements, and expansion of its direct to consumer strategy.
The past three months have been quite unfavorable for Under Armour. Unusually warmer weather dragged down sales of the company’s winter apparel and footwear segment. Winter clothing typically entails higher margins and as these products go on sale, this will prove to be a drag on margins. That said, Under Armour’s strong FY 2015, which reported its first quarter of over $1 billion in revenue, has set a promising tone for 2016. The company’s fastest growing sector, footwear, continues to outpace the overall business led by the launch of NBA champion, Stephen Curry’s exclusive shoe line. Other notable athletes endorsed by Under Armour include NFL quarterback, Tom Brady and pro golfer, Jordan Spieth. Under Armour has also announced a line of connected footwear and apparel which track key fitness metrics while you exercise. It is anticipated that Health Box will stimulate revenue growth, but also attract new customers to the Under Armour ecosystem. Though the company generates a majority of its revenue from the United States, it intends to expand operations globally in an effort to reach a broader customer base. With a strong foundation in place, these past adverse months should not prove to be indicative of Under Armour’s 2016. 

