
The buyers repelled the opening selling pressure, and gradually made their way higher. While it wasn’t smooth sailing throughout the whole session, they overcame every attempt of the sellers. Closing near the daily highs, and with futures little changed during the premarket session, can the buyers repeat their performance later today as well?
In the search for answers, let’s check the daily chart (charts courtesy of http://stockcharts.com).
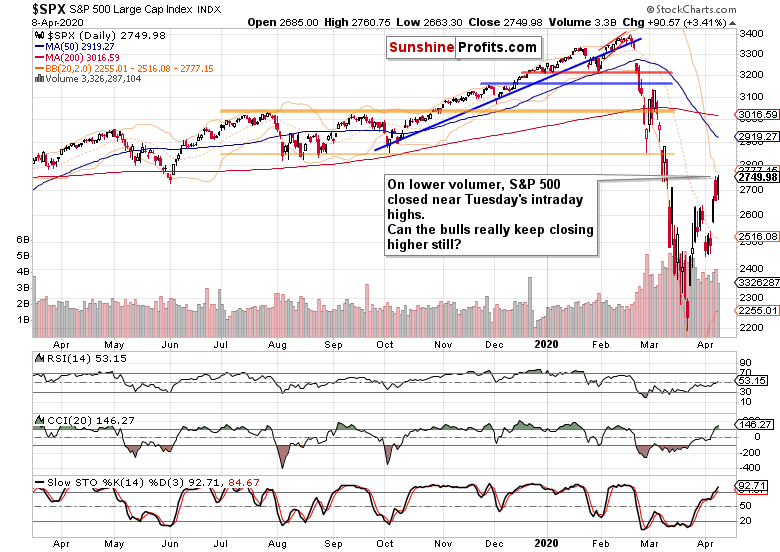
The volume declined on a day-to-day basis, making yesterday’s session the lowest- volume one since early March. That certainly merits caution, regardless of the daily indicators stretching to new highs, and a generally supportive debt market action (HYG and HYD ETFs).
The question is whether the bulls can keep scoring further gains.
Let’s quote from today’s Gold & Silver Trading Alert as it superbly illustrates the 2008 parallels to today.
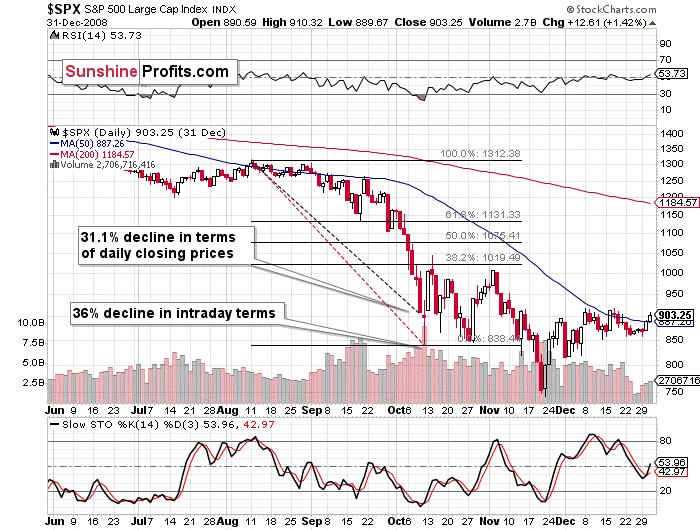
First of all, let’s keep in mind that back in 2008, after the most volatile short-term decline – and the one most similar to what we saw in February and March – stocks corrected between 38.2% and 50% of their previous downswing before moving back down.
Stocks moved to the same resistance zone this week. Of course, that’s not the only topping sign, we have three more:
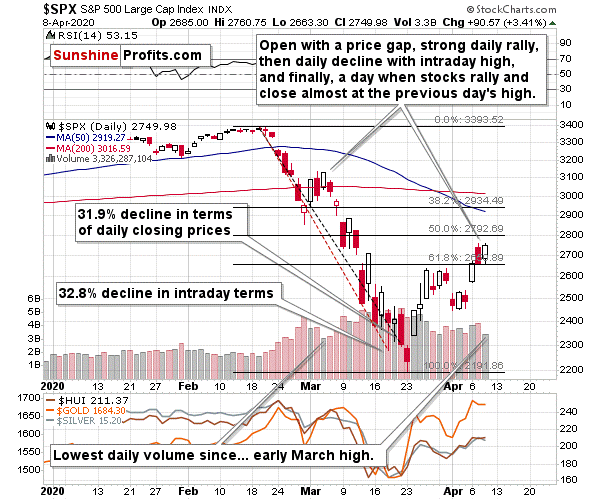
1. Stocks moved to their previous price gap, which stopped practically all previous rallies since late February. The early March rally ended once stocks moved to the Feb 26 price gap (upper border). The March 10 correction ended when stocks tried to move above the previous day’s price gap. The same with the March 13 correction. Right now, stocks moved to the upper border of the price gap created after the March 11 close. Based on the closing prices, the gap was closed yesterday, but the same thing happened on March 4, right before the biggest slide, which brings us to the second point…
2. The last three trading days are almost exactly as the first three sessions of March. The daily rally that starts with a bullish price gap, then a daily decline with some sort of intraday reversal, and finally a daily rally that ends the day very close to previous day’s intraday high. Based on this similarity, the next huge downswing is about to start.
3. The volume that we saw yesterday was the lowest since… March 4. This is yet another confirmation of the bearish analogy from point 2, but also a bearish factor on its own. Stocks moved higher on volume that was low on a relative basis and that’s a bearish sign by itself. We wholeheartedly subscribe to the above analysis, and are of the opinion that attempts to move higher won’t really cut it. Before sharing our fundamental take on the situation, let’s add one more technical clue in support of our open short position.
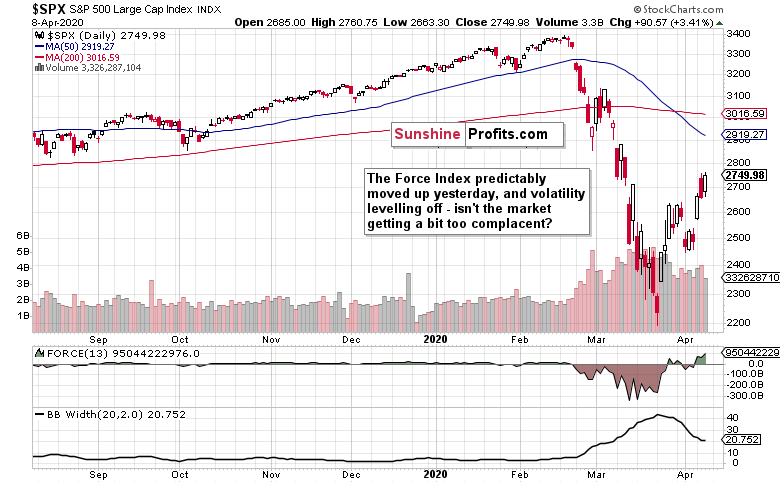
Regardless of the relatively low daily volume, when prices move higher, so does the Force index. But do the bulls have all their ducks in a row?
As a minimum from the short-term perspective, Force index is vulnerable to a takedown. Decreasing volatility is all fine and dandy, as stocks usually go higher at a slower pace than they decline. But isn’t the market getting a bit ahead of itself?
Seriously, it’s one thing to cheer a few signals that the coronavirus infection curve might (might) be flattening in some of the hardest-hit areas (be it in the States or in Europe), but can such a conclusion be already taken for granted by the market?
Remember, not even all the incoming data from the State of New York counties point to this assessment. Sure, the lockdowns have slowed the virus spread, but the measures to flatten the curve have overreaching economic consequences, the knock-on effects of social distancing. In our opinion, it’s highly premature and unfounded to cheer the V-shaped recovery prospects as stocks are doing right now.
Putting a stop to the bleeding and return to economic normalcy are two different matters entirely. Sooner or later, the market will likely question the point in time and price paid for doing so – more so than it does now. And medically speaking, after a period of gradual relaxation, China had to tighten the screws again as the example of Jia county in Henan province in early April shows.
Meanwhile in Italy and throughout much of Europe, the lockdowns are being extended. The situation is unprecedented, and stocks appear to view the current turn for the better with rose-tinted colors.
Despite the short-term bullish S&P 500 move, the fluid coronavirus impact situation will facilitate the return of the bears.
Summing up, the bulls seized the short-term momentum, and extended gains yesterday. Despite the short-term bottom looking very likely to be, stocks aren't out of the woods just yet. The bear market that took stocks off their mid-Feb highs, doesn’t appear to have run its course yet. The bulls are likely to stumble again as the coronavirus crisis enters another stage of market’s assessment.