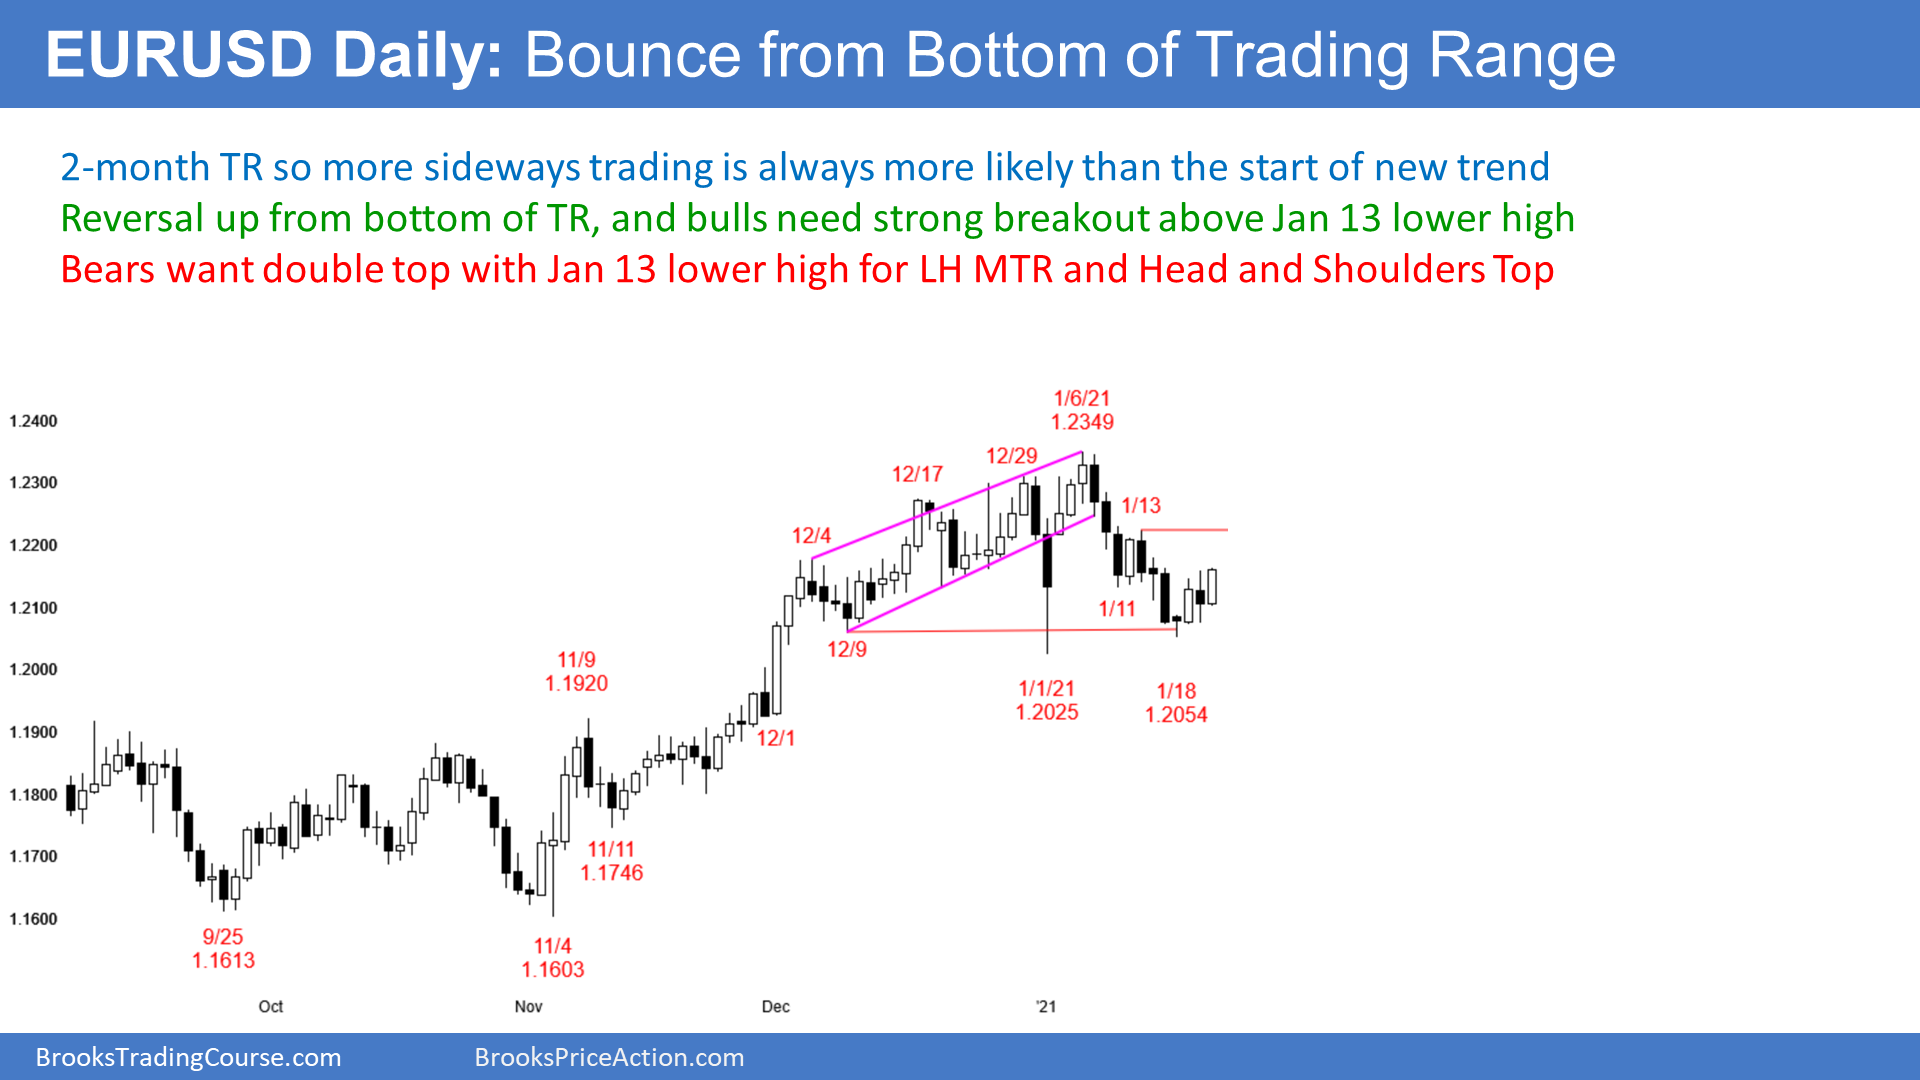
The EUR/USD forex market on the daily chart has been in a trading range for 2 months. Trading ranges can last a long time. Most breakout attempts fail.

The EUR//USD has been reversing up for several days after testing the bottom. This 3-day rally is a test of the Jan. 13 lower high. If the bulls can break strongly above it, traders will expect another attempt to break above the top of the range.
The bears will try to form a double top with that high. If the EUR/USD reverses down from there, traders would look for another test of the bottom of the range. The rally would be a lower high major trend reversal, and the right shoulder of a head and shoulders top. That would be a sell setup.
While that sounds great for the bears, there is only a 40% chance that any major trend reversal will actually lead to a major trend reversal. The bears would still need consecutive closes below the bottom of the range (the January 1 low) before traders will conclude that the trading range had broken out into a bear trend.
While a trading range is neutral, the probability fluctuates a little within it. It depends on the strength of the legs up and down, and on the ever-changing patterns.
There is currently better than a 50% chance that the bears will win. However, if this 3-day rally breaks strongly above the Jan. 13 high, the odds will shift to being slightly in favor of the bulls. What happens around that January 13 high over the next week will be important. It will give traders a clue about what to expect over the next couple weeks and maybe over the next couple months.
Overnight EURUSD Forex trading
The 5-minute chart of the EUR/USD Forex market has been rallying overnight. It is now above yesterday’s high. Traders expect a test of the Jan. 13 lower high over the next few days.
The overnight rally has been in a bull channel. That is a weak trend. It usually evolves into a trading range. But until there is a 20-pip pullback, day traders will focus on buying. Once it transforms into a trading range, day traders will also sell for scalps.
Can today accelerate up and break above the Jan. 13 lower high? Probably not. The 3-day rally has had a lot of overlap on the daily chart. It looks more like a weak leg up in the 2-month trading range on the daily chart, rather than the start of a bull trend.
What about a reversal down today? It is trading just above yesterday’s high, and yesterday was a bear day on the daily chart. That is not a good buy signal bar. It could reverse down, but traders really want to see what will happen at the Jan. 13 high. Therefore, if today reverses down, it will probably be minor. There is still about 50 pips of room left to that magnet above, and the EUR/USD will probably get there within a few days.
