The results of the Fed's November meeting led the markets to a widespread strengthening of the US dollar. The EUR/USD quotes are again in close proximity to the area of annual lows. The pair GBP/USD is trying to break down the level of 1.3000. Today is published a large block of statistics of the British economy. The main indicator is the UK GDP data for the 3rd quarter. Players' expectations are at 1.5% (y/y). If the statistics do not disappoint, the British pound may lead the counterattack on the US dollar.
In yesterday's overview, I shared my thoughts on the future medium-term dynamics of the markets, suggesting a weakening of dollar, pointing the factors which indicates a possible realization of this scenario. However, this does not mean that the weakening of the dollar against the leading world currencies should occur immediately. I take the liberty to assume. that the reaction of the markets to the results of the November meeting of the American regulator is a short-term factor. Based on a combination of fundamental factors and the current technical picture of the market, I remain on the point of view according to which the period of strengthening of the American currency ended. For a better presentation of the technical picture of trading, in this overview, the graphs of the analyzed instruments are shown on larger time frames.
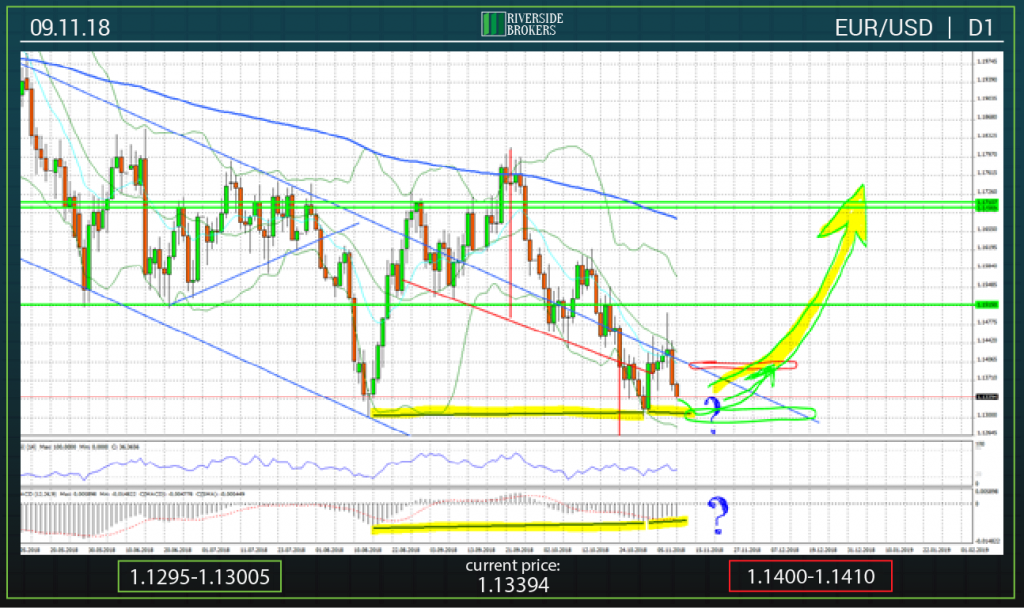
The EUR/USD pair chart is presented on the D1 time frame. As noted in previous reviews, there is a convergence between the minima of mid-August and late-October quotes and the corresponding MACD indicator values. The negative dynamics observed in the markets, as a result of the hawkish position of the Fed, led the pair into close proximity to the area of annual minimums. The main question of today is: will the retest of these price minima take place and will be formed a new convergence form between minima and MACD values? On the attached chart, this situation is indicated by question marks. Doubtless, the pair will react sharply to the published statistics on the UK economy. From my point of view, the actual values of the indicators will help to rebound quotes from the support zone located near the 1.1300 mark. The big yellow arrow indicates the medium-term goal of positive price dynamics (area 1.1700-1.1710), as mentioned in yesterday's article.
Zones of support and resistance are today in the areas of 1.1295-1.13005 and 1.1400-1.1410, respectively.
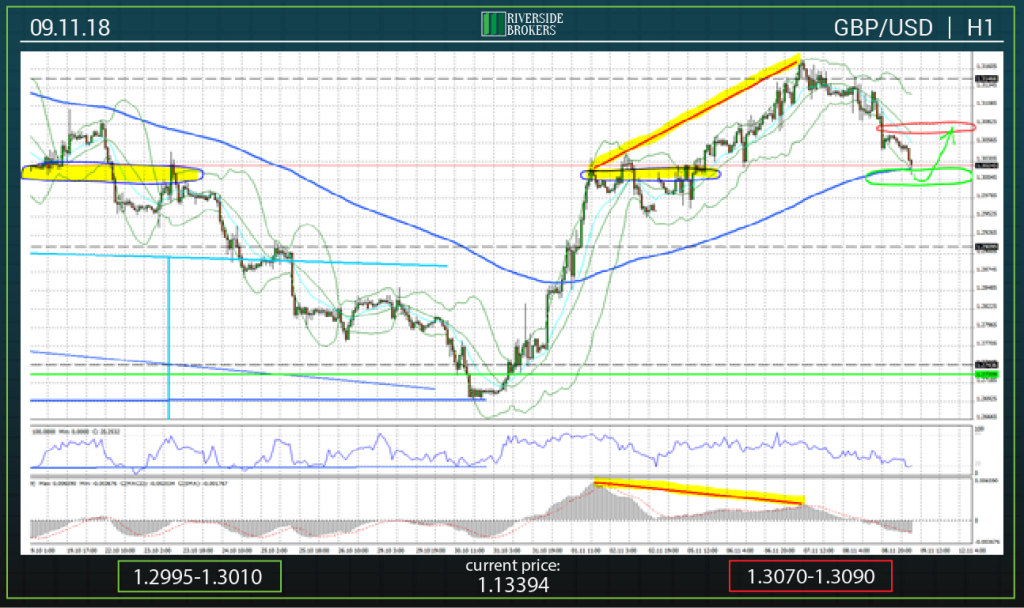
The pair GBP/USD fell to the area of 1.3010-1.3020, where the 200-period MA is located on the time frames H1 and H4. Thus, the correction signal has been fully worked out - the divergence between the maxima of prices and the values of the MACD indicator (highlighted on the chart with a yellow marker). Today, published statistics is important for the dynamics of quotes. In case of meeting the expectations of the markets, the pair will receive a strong growth momentum, which will allow quotes to win back most of yesterday's losses. Strong statistics will contribute to the resumption of medium-term positive dynamics. The increase target is located near the 1.3300 mark, as mentioned in yesterday’s article.
The support zone today is in the region of 1.2995-1.3010 (green oval).
The resistance zone is in the range 1.3070-1.3090 (red oval).
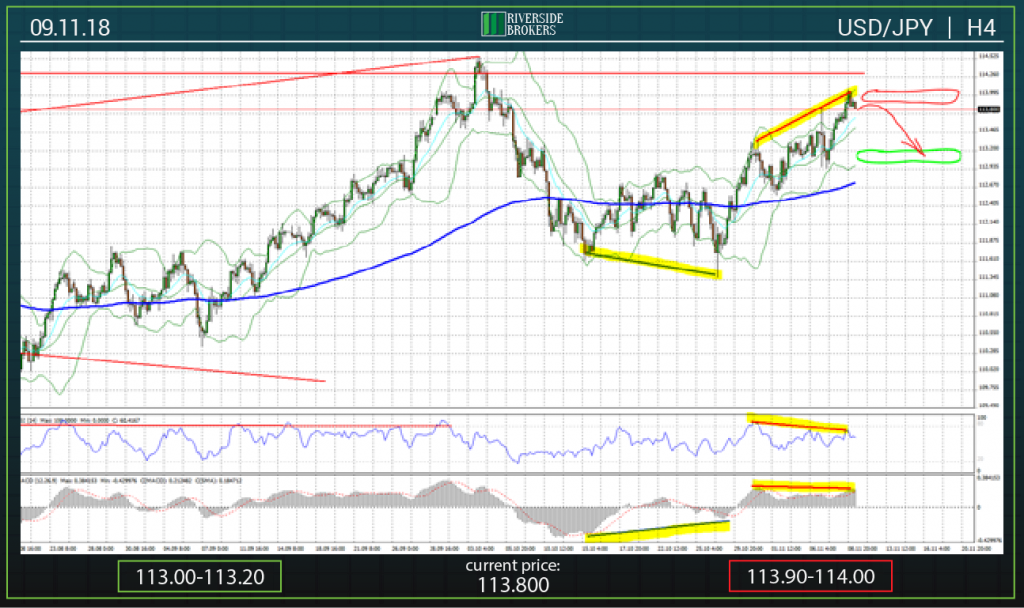
Despite the fact that at the end of the fed meeting the quotes of the USD/JPY pair reached 114.00, the technical picture still indicates the probability of a negative trend. On the presented USD/JPY H4 chart, there is a divergence between the local maximums of the quotes and the corresponding values of the RSI and MACD indicators. Based on this fact, the beginning of a decline in prices is predicted with the aim of reaching the support zone around the 113.00 mark.
The support zone today is the range 113.00-113.20 (green oval).
The resistance zone is located in the area of 113.90-114.00 (red oval).
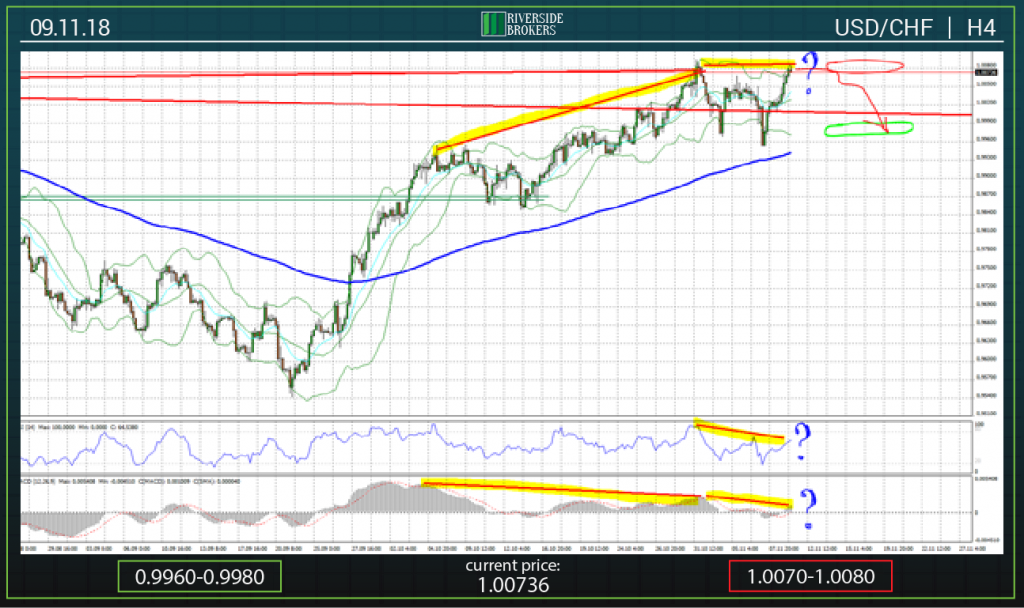
On the chart of the USD/CHF pair, the question marks highlight the situation that requires solution. Namely, will a new divergence be formed between the price maxima and the corresponding values of the RSI and MACD indicators? I guess the answer will be yes. In this case it is predicted, by me the long-expected, negative dynamics of quotations. The goal of a possible reduction is the area of the 200-periodic MA, located near the mark of 0.9940. The implementation of this scenario may begin after the publication of data on the UK economy in the middle of today.
The support zone is present in the area of 0.9960-0.9980 (green oval).
Resistance is the range 1.0070-1.0080 (red oval).
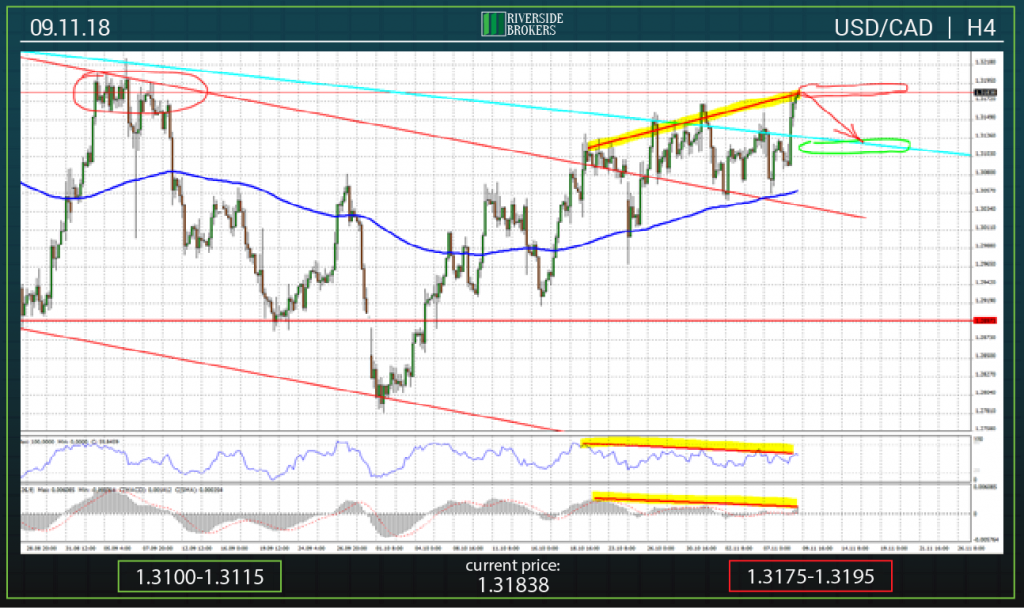
As a result of the strengthening of the US dollar in world markets, which occurred after the announcement of the results of the November Fed meeting, the USD/CAD pair quotes reached the area of maximum prices observed from the 4th to the 6th of September this year. It is just in the specified range 1.3175-1.3195 that the resistance zone is located today. On the USD / CAD H4 chart, there is a divergence between price peaks and RSI and MACD indicator values (highlighted in the chart with a yellow marker). This fact allows to stay on the point of view, according to which prices are projected to decline in order to return to the multi-year border, displayed on the chart with a blue line. This line is located in the range 1.3100-1.3120.
Support is in the 1.3100-1.3115 area (green oval).
Resistance is located at 1.3175-1.3195 (red oval).
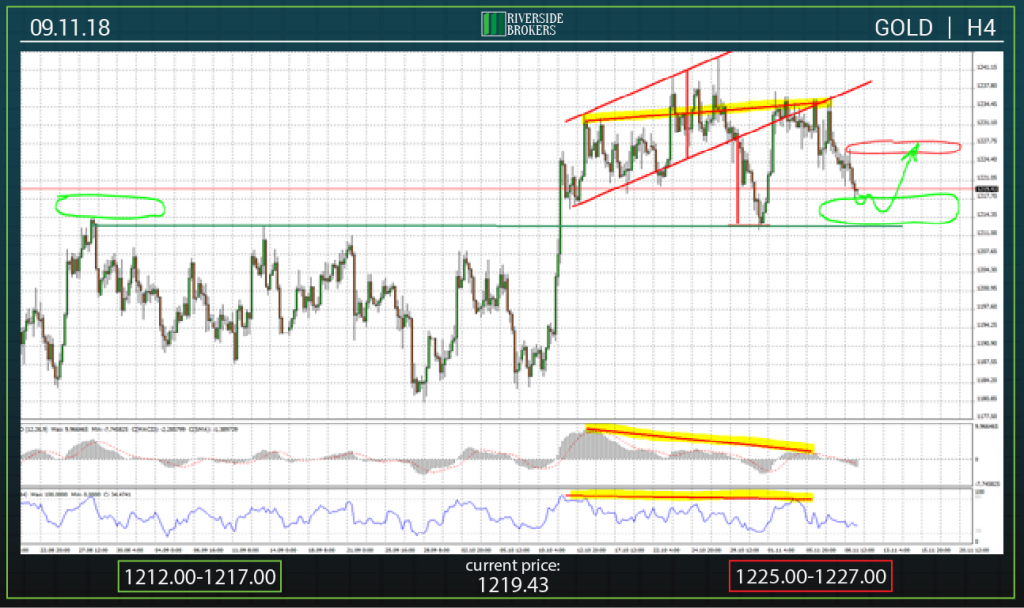
Gold quotes again approached the support zone located near the 1212.00 mark. The area in the immediate vicinity of this mark is the range of maximum gold prices in the period from late August to 10 October, which indicates its good sales and, as a result, its strength. Today, it is predicted to stop the decline in quotations and a gradual increase in order to grow 1227.00.
The support zone is located in the area 1212.00-1217.00 (green oval).
Resistance is present in the range 1225.00-1227.00 (red oval).