
On Apr 3, 2019, Bitcoin Cash reached a high of $354. It has been on a downtrend since, reaching lows of almost $250.
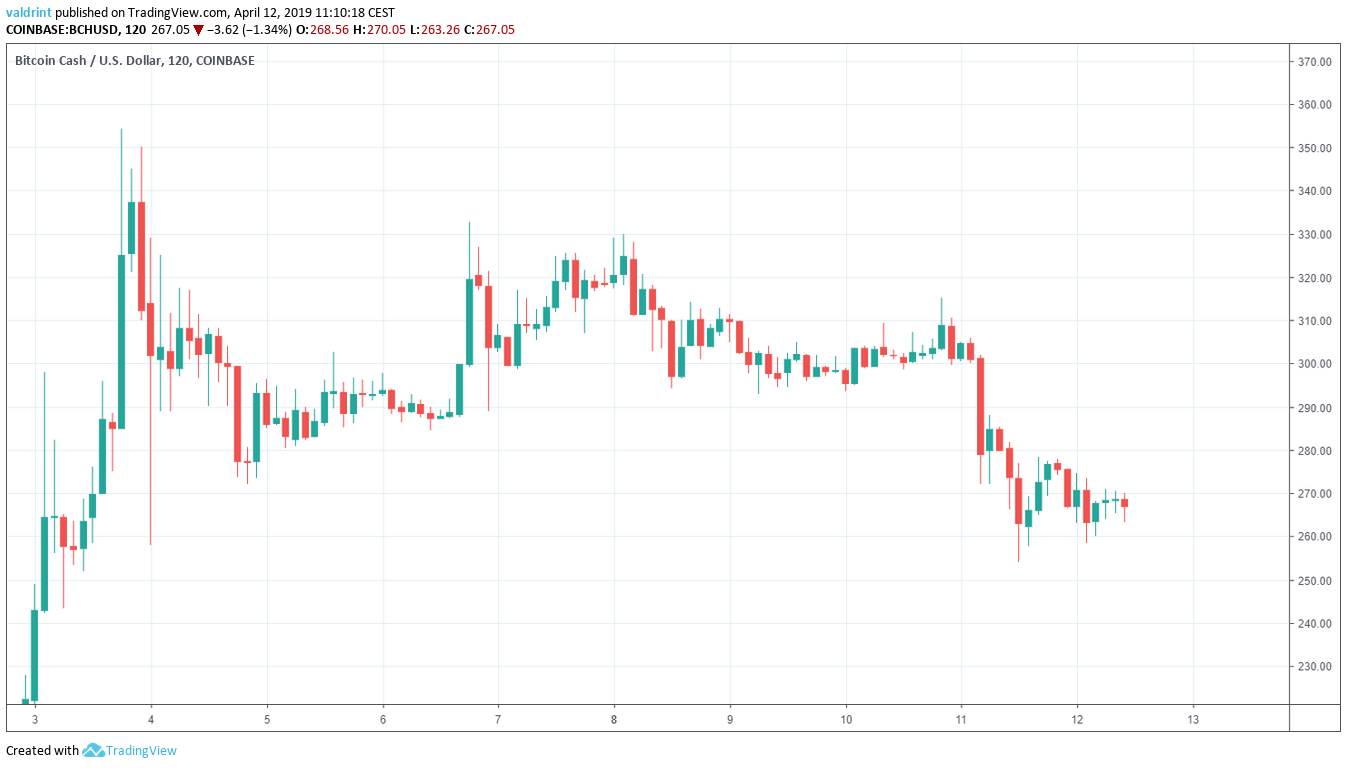 Bitcoin Cash (BCH) Prices: Apr 3 – Apr 12
How long will this downtrend last?
Let’s find out.
Bitcoin Cash (BCH): Trends For April 12, 2019
- The price of BCH/USD has been on a downtrend since Apr 3.
- Bitcoin Cash is trading inside a descending wedge
- Bullish divergence is developing in the RSI.
- There is resistance near $285.
Descending Wedge
The price of BCH on Coinbase is analyzed at two-hour intervals from Apr 3 to Apr 12. This is done in order to trace the current trading pattern.
On Apr 5, the price reached an hourly low of $272.0. A gradual upward move was followed by a sharp decrease.
The price has made several lower lows.
Tracing these lows gives us a descending support line: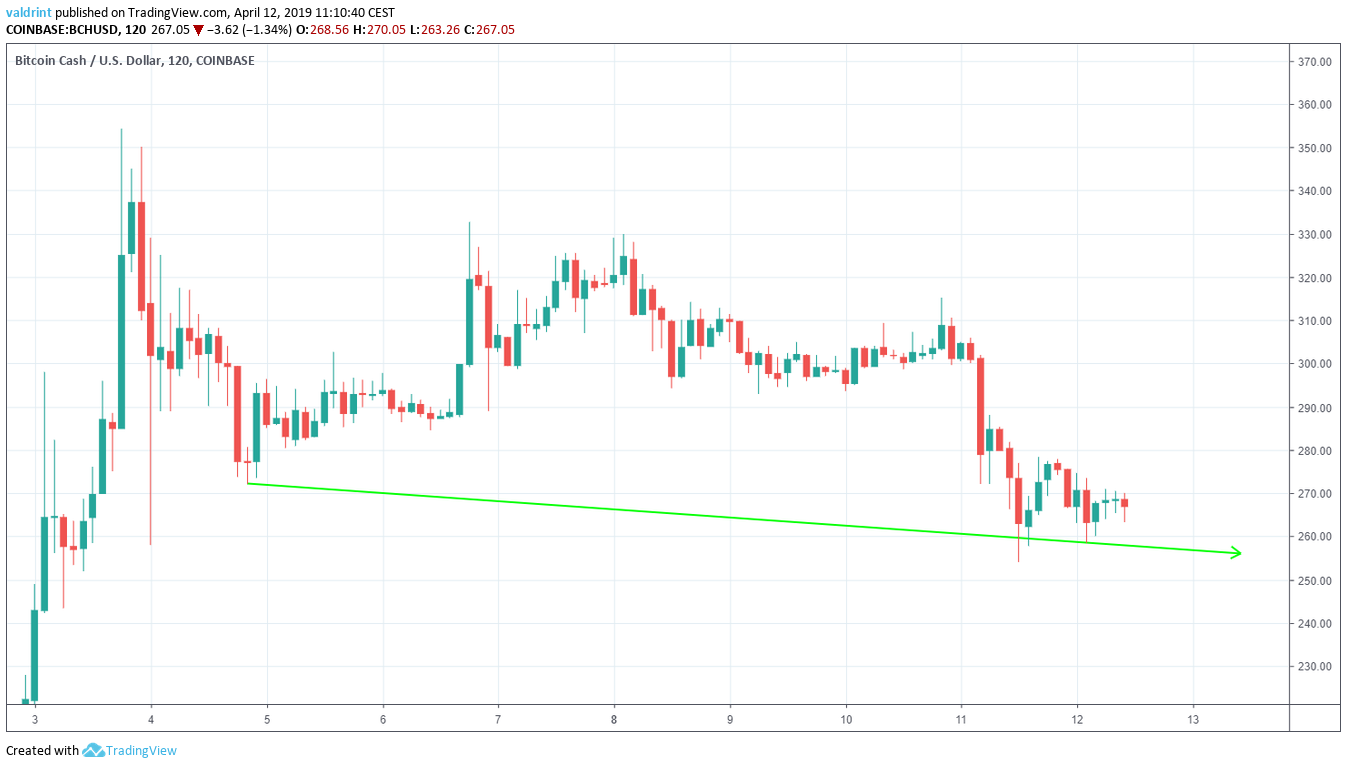
On Apr 3, the price reached an hourly high of $354.17. Several market cycles have been completed, and the price has made a lower high each time.
Tracing these highs gives us a descending resistance line.
Together, the resistance and support lines combine to create a descending wedge:
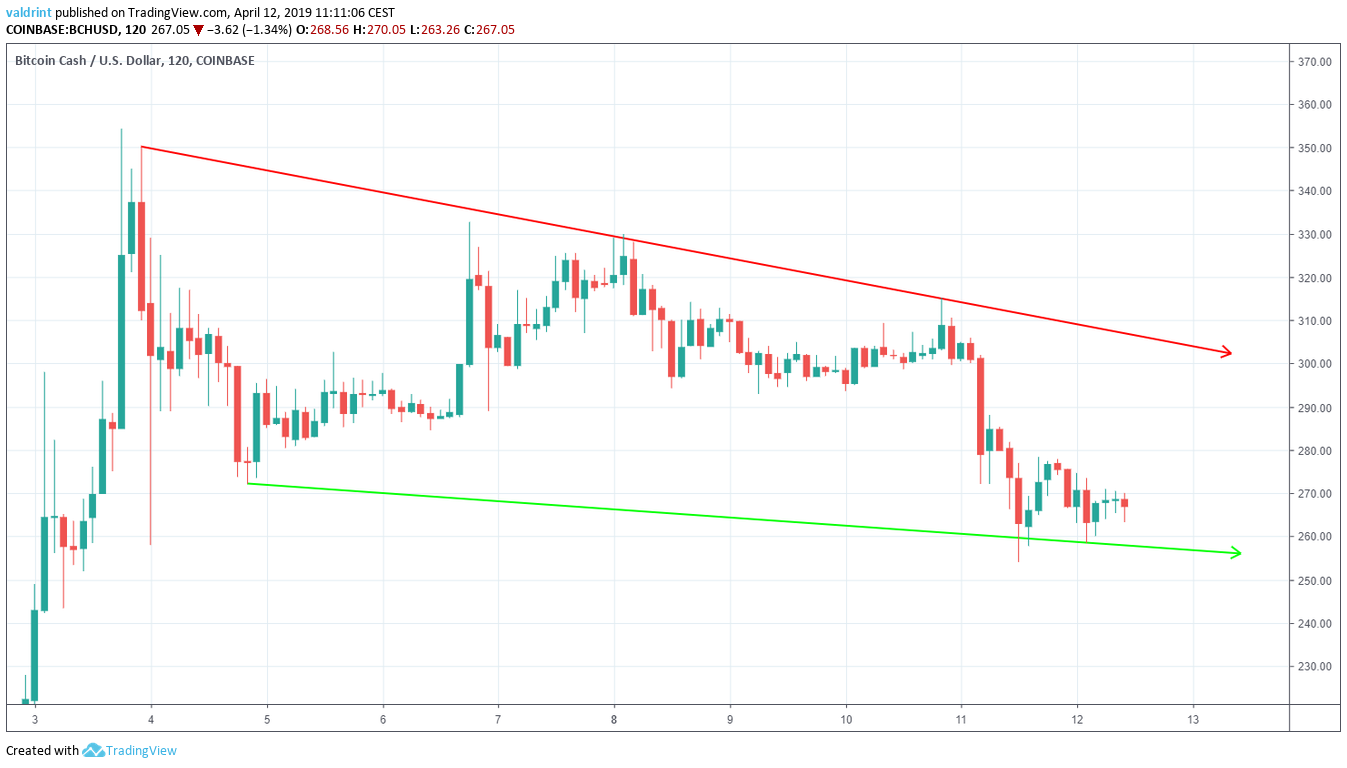
It is likely that the price will keep decreasing at the rate predicted by the wedge until a decisive move occurs.
In order to predict the direction of this move, a look at technical indicators is required.
Technical Indicators
We begin with moving averages.
Moving averages are tools used in technical analysis to smooth out price action. It is a lagging indicator since it is based on past prices. The relationship between short and long-term moving averages can help in identifying the beginning and end of a trend.
The 20- and 50-period moving averages (MA) are traced in the graph below. 20-period MAs are traced in red while 50-period MAs are traced in green.
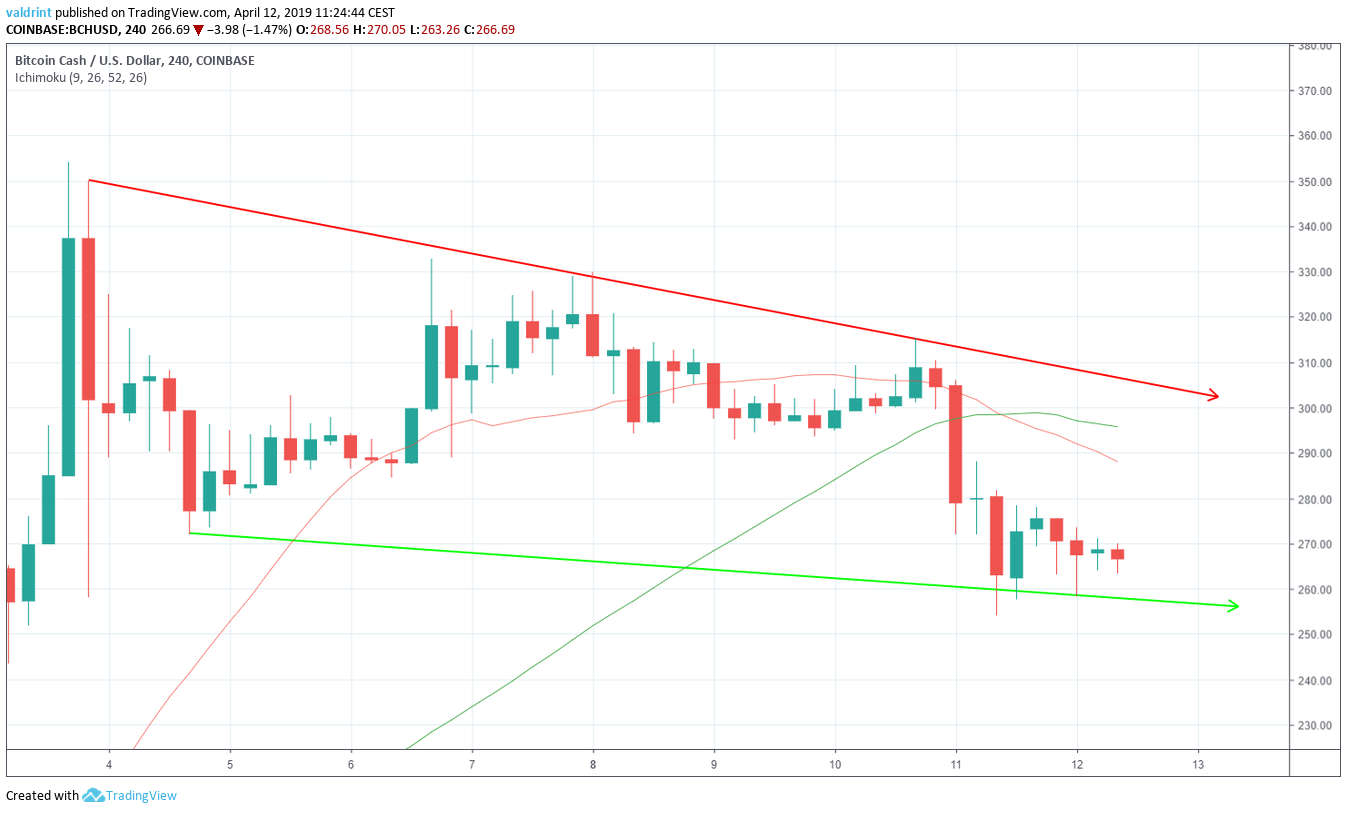
On Apr 11, the 20-period MA crossed below the 50-period MA.
This is known as a bearish cross and may indicate that a new downtrend may have begun.
Using this indicator, it is unlikely that the price breaks out of the current pattern. However, it is not sufficient in predicting a breakdown. Therefore, it is likely that the price will keep trading inside the wedge.
Future Movement
To determine future price levels, we now look at possible resistance areas.
Resistance areas are created when the price revisits the same level several times. They can provide reversal areas in case a breakout/breakdown occurs.
One resistance area is traced in the chart below:
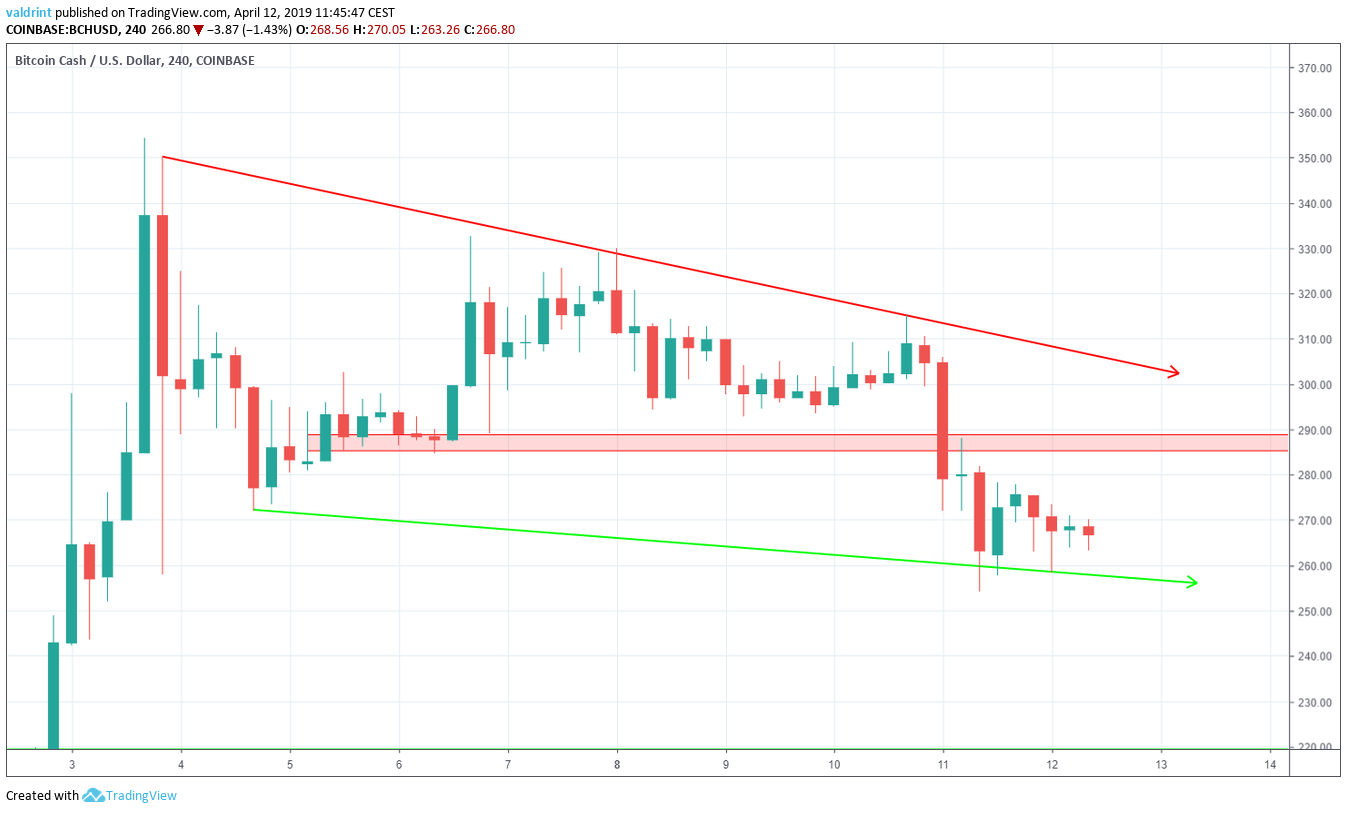
The closest resistance area is found near $285. If the price were to increase towards the resistance line, it is likely that it will reach this area first.
Summary of Analysis
The price of BCH is likely to keep trading inside the confines of the descending wedge. It is possible that it will reach the resistance area outlined above. This means that while price may not reach $300, prices may reach $285. Prices still might move toward $300, but there is likely going to be volatility along the way.
Disclaimer:
This article is not trading advice and should not be construed as such. Always consult a trained financial professional before investing in cryptocurrencies, as the market is particularly volatile.