Constellation Brands, Inc. (NYSE: STZ ) is an international producer and marketer of wine, beer, and spirits. The Company markets imported beer in the United States. through its investment in Crown Imports, LLC (CROIMPP), a joint venture with Grupo Modelo, S.A.B. de C.V. (GMODELOC:Mexico) pursuant to which Modelo’s Mexican beer portfolio (the Modelo Brands) are imported, marketed and sold by the joint venture in the United States.
The stock popped on 2-14-2012 from $31.88 to $43.75. Here's the news on that move:
What: Shares of Constellation Brands (NYSE: STZ ) were heading for the stars today, climbing as much as 38%, after a new agreement was reached between AnheuserBusch InBev and Grupo Modelo that would appear to pass Department of Justice's muster.
So what: The government had planned to file an antitrust suit against AB InBev's original plan to buy Modelo, but the world's largest beer maker has said it will now sell Modelo's Piedras Negras brewery near the U.S. border to Constellation for $2.9 billion. The deal gives Constellation, the world's largest wine maker, the rights to sell Corona and other Modelo brands in the U.S., and would alleviate the concerns about AB InBev gaining further market share in the U.S. The DOJ has not yet commented on the new deal, but analysts believe it should satisfy the agency's antitrust concerns.
Source: The Motley Fool via yahoo! Finance; Why Constellation Shares Soared, written by Jeremy Bowman.
The stock just came up on a real-time custom scan. This one hunts for calendar spreads between the front two months.
Custom Scan Details
Stock Price: GTE $5
Sigma1 - Sigma2 GTE 8
Average Option Volume: GTE 1,000
Industry isNot Bio-tech
Days After Earnings: GTE 5 LTE 70
Sigma1, Sigma2 GTE 1
The goal with this scan is to identify back months that are cheaper than the front by at least 8 vol points. I'm also looking for a reasonable amount of liquidity in the options (thus the minimum average option volume), want to avoid bio-techs (and their crazy vol) and make sure I'm not selling elevated front month vol simply because earnings are approaching.
Let's take a look at the Skew Tab, to start.
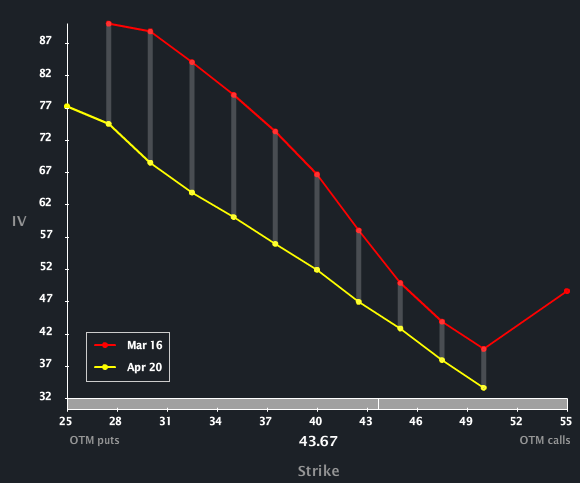
We can see a similar shape across both months with March elevated (in vol) to April across all strikes. I can also note the slight expansion of the vol to the downside - a sort of widening divergence. More to follow ...
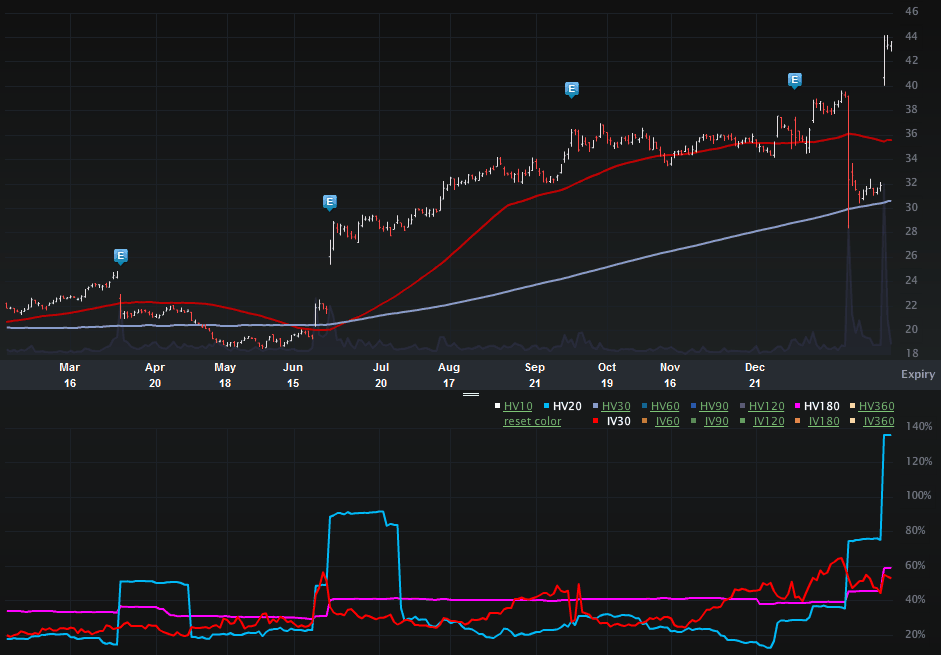
Now we can turn to the one-year Charts Tab (below). The top portion is the stock price, the bottom is the vol (IV30™ - red vs HV20™ - blue vs HV180™ - pink). 
On the stock side we can see the explosion on 2-14 off of that deal news wrt DOJ. But even without that pop, the stock has been on an upward trajectory for the last 12 months.
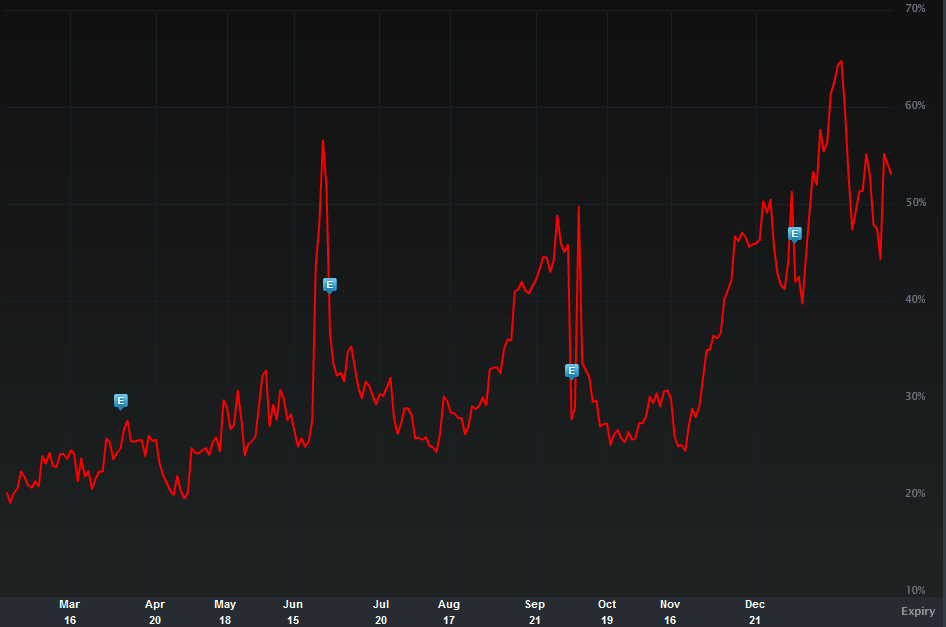
In order to get a better look at the vol, I have included the one-year IV30™ chart below.
We can see that while the implied has drifted away from the annual high it reached not too long ago, the trend in IV30™ has generally been up (like the stock). In English, as the price has appreciated, the option market has reflected increased risk - sort of the opposite of "normal" behavior.
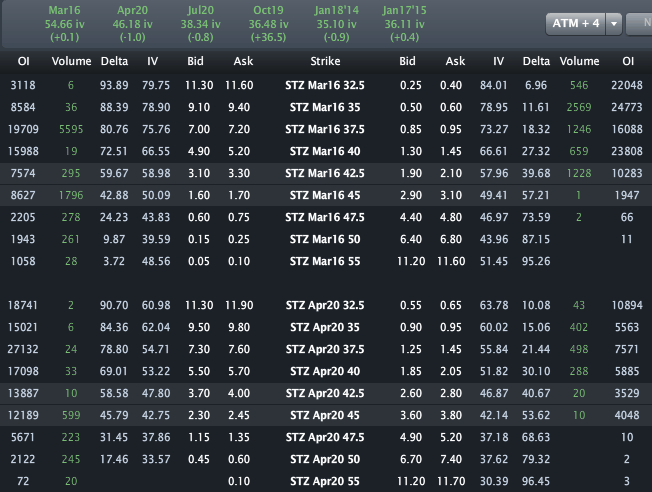
Finally, let's look to the Options Tab (below).
Across the top we can see Machr is priced to 54.66% and April is priced to 46.18% -- it's that vol diff that triggered the scan. Just as an example of how the vol difference widens to the downside, while the ATM vol diff is ~10 vol points, the Mar/Apr 32.5 put spread shows more than a 20+ vol point diff.
Disclosure: This is trade analysis, not a recommendation.
Images provided by Livevol®
- English (UK)
- English (India)
- English (Canada)
- English (Australia)
- English (South Africa)
- English (Philippines)
- English (Nigeria)
- Deutsch
- Español (España)
- Español (México)
- Français
- Italiano
- Nederlands
- Português (Portugal)
- Polski
- Português (Brasil)
- Русский
- Türkçe
- العربية
- Ελληνικά
- Svenska
- Suomi
- עברית
- 日本語
- 한국어
- 简体中文
- 繁體中文
- Bahasa Indonesia
- Bahasa Melayu
- ไทย
- Tiếng Việt
- हिंदी
Calendar Vol Diff Opens After Constellation Shares Head For The Stars
Published 02/20/2013, 05:04 AM
Updated 07/09/2023, 06:31 AM
Calendar Vol Diff Opens After Constellation Shares Head For The Stars
Latest comments
Loading next article…
Install Our App
Risk Disclosure: Trading in financial instruments and/or cryptocurrencies involves high risks including the risk of losing some, or all, of your investment amount, and may not be suitable for all investors. Prices of cryptocurrencies are extremely volatile and may be affected by external factors such as financial, regulatory or political events. Trading on margin increases the financial risks.
Before deciding to trade in financial instrument or cryptocurrencies you should be fully informed of the risks and costs associated with trading the financial markets, carefully consider your investment objectives, level of experience, and risk appetite, and seek professional advice where needed.
Fusion Media would like to remind you that the data contained in this website is not necessarily real-time nor accurate. The data and prices on the website are not necessarily provided by any market or exchange, but may be provided by market makers, and so prices may not be accurate and may differ from the actual price at any given market, meaning prices are indicative and not appropriate for trading purposes. Fusion Media and any provider of the data contained in this website will not accept liability for any loss or damage as a result of your trading, or your reliance on the information contained within this website.
It is prohibited to use, store, reproduce, display, modify, transmit or distribute the data contained in this website without the explicit prior written permission of Fusion Media and/or the data provider. All intellectual property rights are reserved by the providers and/or the exchange providing the data contained in this website.
Fusion Media may be compensated by the advertisers that appear on the website, based on your interaction with the advertisements or advertisers.
© 2007-2024 - Fusion Media Limited. All Rights Reserved.
