🚀 AI-picked stocks soar in May. PRFT is +55%—in just 16 days! Don’t miss June’s top picks.Unlock full list

Buyers Still To Be Found

Published 04/04/2016, 10:14 AM
Updated 07/09/2023, 06:31 AM
SPY
-
AMZN
-
NFLX
-
MJN
-
TLT
-
VIX
-
USO
-

Technical Outlook:

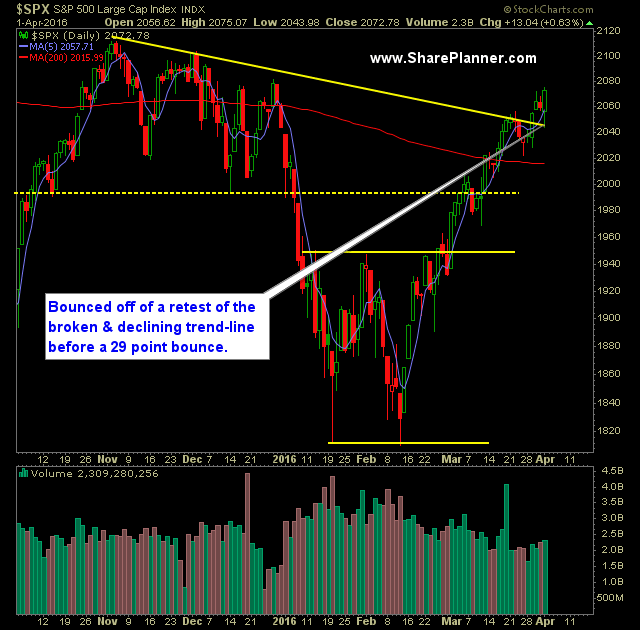
  • The bullish strength of this market since mid-February was on full display Friday when the market gapped down significantly and pushed 16 points lower, bottomed within the first 30 minutes of trading and then rallied 29 points off of those lows throughout the remainder of the day.
  • To put it mildly, gap downs have been the bear's worst nightmare. Rarely has a gap down been sustained since mid February when the rally started.
  • On (NYSE:SPY), a massive bullish engulfing pattern on the ETF.
  • Strongest volume reading for SPY since 3/18 and right near average levels of late.
  • The downtrend off of the July highs becomes the next testing point for this market as it seeks push through its resistance at 2095 an back into the 2100's.
  • 2100 is also significant because a close above this level potentially jeopardizes the two-year long standing head and shoulders pattern that the market has had in development. A close above 2116 absolutely destroys the pattern.
  • (NYSE:USO) sold off for an eight consecutive day and the ninth time in the last ten trading sessions. The 50-day moving average is being tested here as is the Fibonacci 50% reetracement level.
  • Using the weekly chart of the VIX, a rising trend-line off of the July 2014 lows is being tested as support here.
  • T2108 (% of stocks trading above their 40-day moving average) continues to trade at its highs with 86% of stocks doing so.
  • April has been bullish in nine of the last ten years.
  • SPX 30-minute chart has established a new higher-high on its chart.
  • Once again the 5-day and 10-day moving averages held together.
  • Yellen's dovish outlook as it pertains to rate hikes has been, in large part, the reason for the massive rally off of the February lows.
  • Support continues to come in on any and all tests of the 10-day moving average.

My Trades:

  • Sold (NYSE:MJN) on Friday at $85.81 for a 4.6% gain.
  • Added one new swing-trade on Friday.
  • Currently 40% Long / 60% Cash
  • Remain long (NYSE:TLT) at $129.52, (NASDAQ:AMZN) at $581.21, (NASDAQ:NFLX) at $102.50.
  • Will look to add 1-2 new additional positions today if dip buyers show any desire to buy up the early weakness.

S&P 500

Original post

Latest comments

Loading next article…
Risk Disclosure: Trading in financial instruments and/or cryptocurrencies involves high risks including the risk of losing some, or all, of your investment amount, and may not be suitable for all investors. Prices of cryptocurrencies are extremely volatile and may be affected by external factors such as financial, regulatory or political events. Trading on margin increases the financial risks.
Before deciding to trade in financial instrument or cryptocurrencies you should be fully informed of the risks and costs associated with trading the financial markets, carefully consider your investment objectives, level of experience, and risk appetite, and seek professional advice where needed.
Fusion Media would like to remind you that the data contained in this website is not necessarily real-time nor accurate. The data and prices on the website are not necessarily provided by any market or exchange, but may be provided by market makers, and so prices may not be accurate and may differ from the actual price at any given market, meaning prices are indicative and not appropriate for trading purposes. Fusion Media and any provider of the data contained in this website will not accept liability for any loss or damage as a result of your trading, or your reliance on the information contained within this website.
It is prohibited to use, store, reproduce, display, modify, transmit or distribute the data contained in this website without the explicit prior written permission of Fusion Media and/or the data provider. All intellectual property rights are reserved by the providers and/or the exchange providing the data contained in this website.
Fusion Media may be compensated by the advertisers that appear on the website, based on your interaction with the advertisements or advertisers.
© 2007-2024 - Fusion Media Limited. All Rights Reserved.